Flowchart Maker

What Is a Picture Graph?

 Picture Graphs
Typically, a Picture Graph has very broad usage. They many times used successfully in marketing, management, and manufacturing. The Picture Graphs Solution extends the capabilities of ConceptDraw DIAGRAM with templates, samples, and a library of professionally developed vector stencils for designing Picture Graphs.
Business Report Pie. Pie Chart Examples

 Basic Picture Graphs
This solution extends the capabilities of ConceptDraw DIAGRAM (or later) with templates, samples and a library of vector stencils for drawing Picture Graphs.
Types of Flowcharts


Matrix Organization Structure

How to Draw Pictorial Chart. How to Use Infograms

Pictures of Graphs

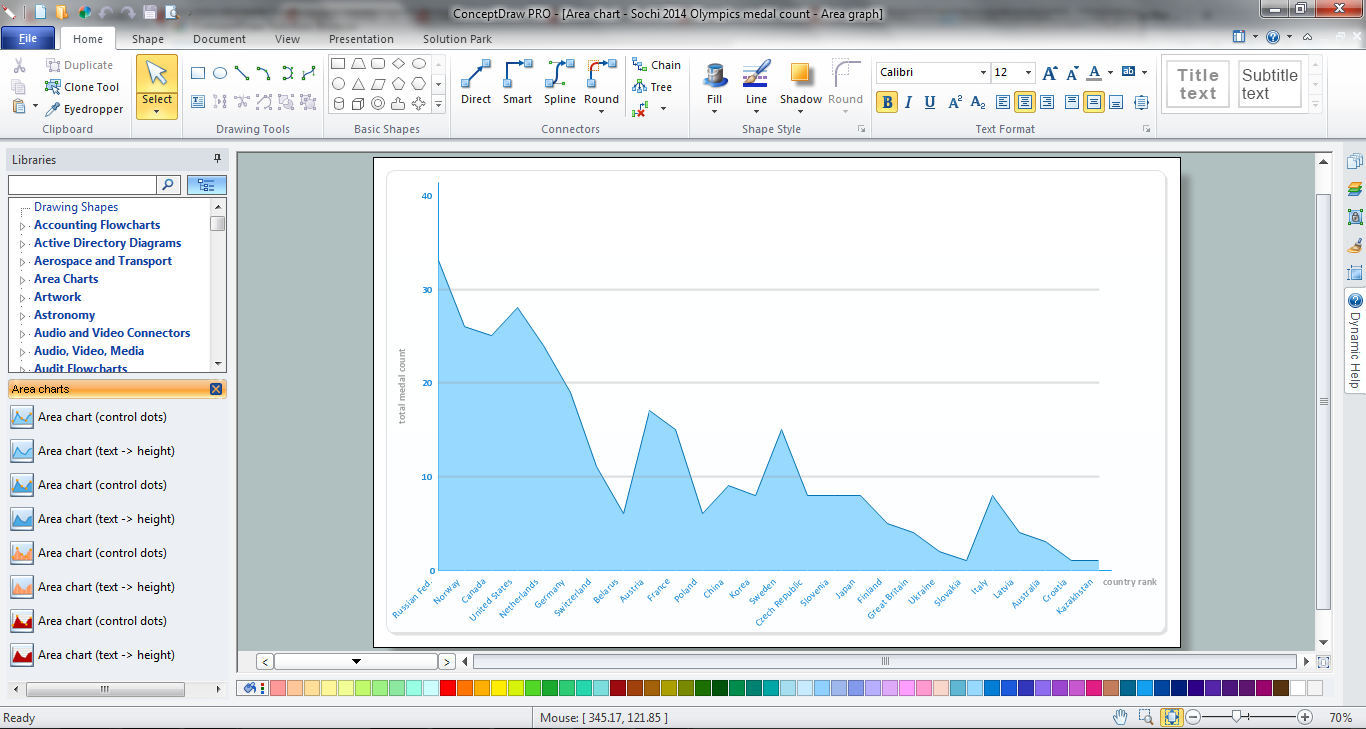
Area Chart
- Picture Graphs | Competitor Analysis | What Is a Picture Graph ...
- Picture graphs - Vector stencils library | Flow chart Example ...
- TQM Diagram Tool | Picture Graphs | Seven Basic Tools of Quality ...
- What Is a Picture Graph ? | Chart Maker for Presentations | Process ...
- Picture Graphs | Pie Chart Word Template. Pie Chart Examples | Bar ...
- Pictures of Graphs | Pictures of Vegetables | Pictures of Food | Pict ...
- Picture Graphs | Process Flowchart | Fishbone Diagram | Graph ...
- Picture graph - Template
- Picture Graphs | Logistics Flow Charts | Bar Diagram Math | Natural ...
- How to Create a Picture Graph | Competitor Analysis | Marketing ...