Cross-Functional Flowcharts
Cross-functional flowcharts are powerful and useful tool for visualizing and analyzing complex business processes which requires involvement of multiple people, teams or even departments. They let clearly represent a sequence of the process steps, the order of operations, relationships between processes and responsible functional units (such as departments or positions).
Gant Chart in Project Management


 Cafe and Restaurant Floor Plans
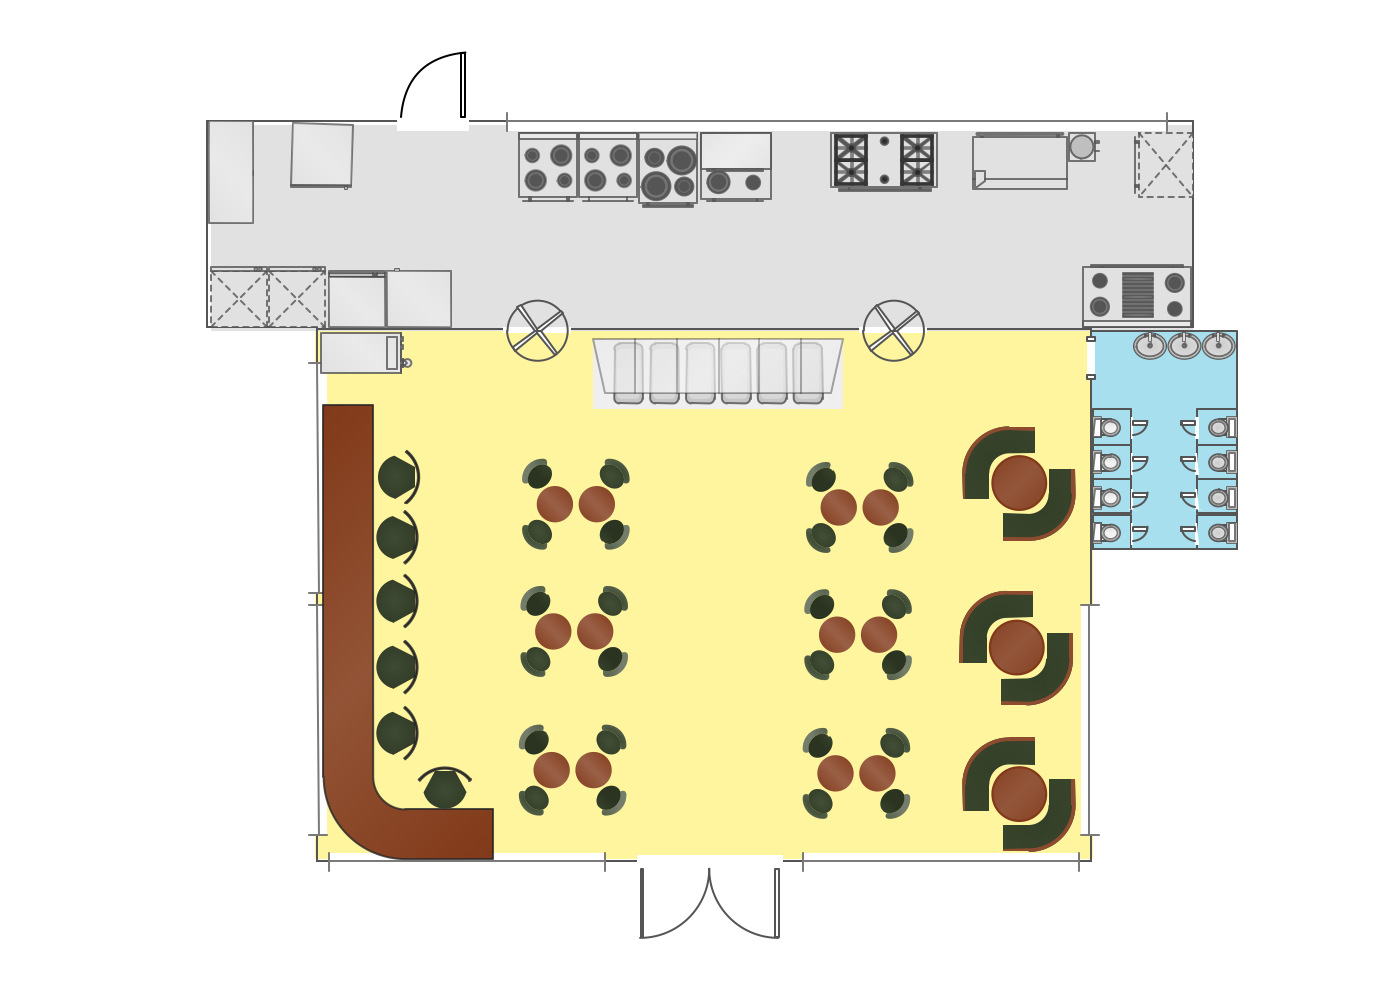
Restaurants and cafes are popular places for recreation, relaxation, and are the scene for many impressions and memories, so their construction and design requires special attention. Restaurants must to be projected and constructed to be comfortable and e
 HVAC Plans
Use HVAC Plans solution to create professional, clear and vivid HVAC-systems design plans, which represent effectively your HVAC marketing plan ideas, develop plans for modern ventilation units, central air heaters, to display the refrigeration systems for automated buildings control, environmental control, and energy systems.
 Seating Plans
The Seating Plans solution including samples, seating chart templates and libraries of vector design elements assists in creating the Seating plans, Seating arrangement charts, Chair layout designs, Plan drawings of cinema seating, Movie theater chair plans, extensive Cinema theater plans depicting the seating arrangement in the cinema halls, location of closet, cafe and food sale area, in designing the Seating plans for the large seating areas, Seat plan designs for airplanes, trains, etc. Use any of the included samples as the table seating chart template or seating chart template free and achieve professional drawing results in a few minutes.
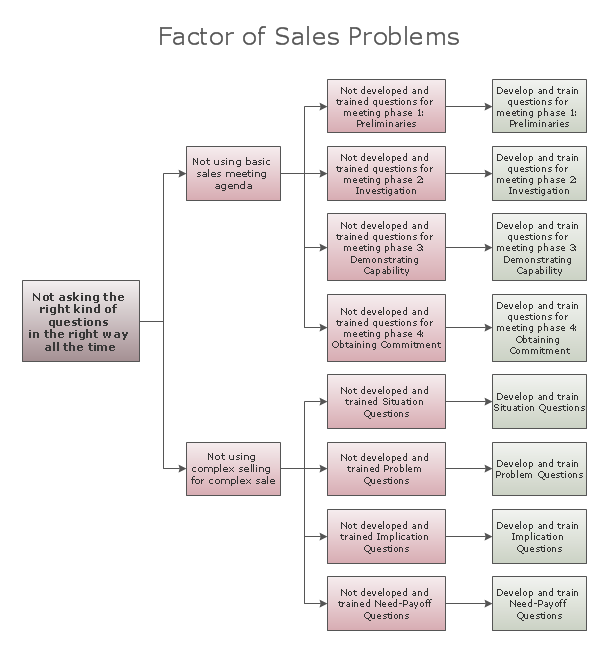
Root Cause Tree Diagram
How to Create a Pie Chart

 Health Package
Health Package is a set of multifaceted solutions intended for visualization and illustration in a field of medicine and health, for drawing colorful, interesting and precise illustrations and infographics that will be used successfully in medical documents, articles, special magazines, posters, billboards, websites, presentations, collages. Having these solutions available, it will not be difficult to illustrate the medical editions, to convey the information in a full and interesting form, to teach students with use effective visual methods, to describe the medical facts, to tell about innovations in a field of medicine, health and correct nutrition, to explain the causes and consequences of different diseases, as well as the measures of their prevention and treatment.
This vector stencils library contains 195 cloud computing icons.
Use it to design cloud computing infographic and diagrams with ConceptDraw PRO software.
"Cloud computing, also on-demand computing, is a kind of Internet-based computing that provides shared processing resources and data to computers and other devices on demand. It is a model for enabling ubiquitous, on-demand access to a shared pool of configurable computing resources (e.g., networks, servers, storage, applications and services), which can be rapidly provisioned and released with minimal management effort. Cloud computing and storage solutions provide users and enterprises with various capabilities to store and process their data in third-party data centers.
Cloud computing has become a highly demanded service or utility due to the advantages of high computing power, cheap cost of services, high performance, scalability, accessibility as well as availability." [Cloud computing. Wikipedia]
The vector stencils library "Cloud clipart" is included in the Cloud Computing Diagrams solution from the Computer and Networks area of ConceptDraw Solution Park.
Access point

Airport

Alert

Banknote

Banknote bundle

Banknote bundles

Backup

Bar chart

Big data

Book (closed)
-cloud-clipart---vector-stencils-library.png--diagram-flowchart-example.png)
Book (open)
-cloud-clipart---vector-stencils-library.png--diagram-flowchart-example.png)
Books

Box, close

Box, open

Braces

Brackets

Bug

Building

Bus

Cable connection

Calculator

Calendar

Car

CD/DVD

Check list

Check mark

Clock

Cloud

Cloud computing

Cloud database

Cloud hosting

Cloud storage

Code

Coffee cup

Coin

Coins stack

Coins stacks

Communication

Computer terminal

Console

CPU

Credit card

Cubes

Dashboard

Database

Databases

Datacenter

Dialog box

Dialog boxes

Document

Documents

Dollar sign

Download

Earth

Email

Equal sign

Ethernet jack

Ethernet plug

Euro sign

Exclamation mark

Eye

Feed symbol

Feedback

File

Files

Filter

Firewall

Flash drive

Folder

Folders

Gamepad

Gauge

Gear

Gears, 2

Gears, 3

Globe

Hacker

Hard drive

Heart

Heart rhythm

Home

Hosting

Hotel

House

Image

Info

IP phone

Jet

Key

Keyboard

Laptop

Lego

Letter

Light bulb

Lightning

Line chart

Linux penguin

List

Load balancer

Location mark

Lock, close

Lock, open

Lock and key

Log

Login

Logout

Magnifying glass

Mail

Map

Memory (RAM)
-cloud-clipart---vector-stencils-library.png--diagram-flowchart-example.png)
Microphone

Minus sign

Mobile phone

Monitor

Mouse

Movie

Music

Music player

Network

Network bus

Newspaper

NIC (Network interface controller)
-cloud-clipart---vector-stencils-library.png--diagram-flowchart-example.png)
Not found (Error 404)
-cloud-clipart---vector-stencils-library.png--diagram-flowchart-example.png)
Notebook

Office printer

Operator

Page

Pages

PC

Pencil

Photo

Photo camera

Pie chart

Platform

Plus sign

Pound sign

Printer

Puzzle

Puzzles, 2x2

Puzzles, 3x3

Question sign

Rackmount server

Router

Safe

Satellite

Satellite antenna

Schedule

Sensor

Server

Server rack

Shield

Ship

Shopping bag

Shopping basket

Shopping cart

Sign up

Smartphone

Social network

Software box

Sound

Spider

Spreadsheet

SSD

Star

Stars, 5

Stethoscope

Stickman

Stickmen

Suitcase

Support

Switch

Syringe

Tablet computer

Tools

Train

Truck

Truck 2

TV

Umbrella

Upload

User man

User woman

User profile

Video

Video camera

Video mail

Virtual disk

Virus

Wallet

Web camera

Wifi antenna

Wireless

Wrench

X cross symbol

Yen sign

Interior Design