This site uses cookies. By continuing to browse the ConceptDraw site you are agreeing to our Use of Site Cookies.

SWOT Matrix Template

A SWOT analysis can be carried out for a product, place, industry or person. It involves specifying the objective of the business venture or project and identifying the internal and external factors that are favorable and unfavorable to achieving that objective.
HelpDesk

How to Create SWOT Analysis Template

SWOT-analysis is used to develop a marketing strategy. SWOT-analysis includes determining the strengths and weaknesses of the company's activity, potential external threats, and opportunities and assesses their relative strategic competitors. ConceptDraw SWOT and TOWS Matrix Diagrams solution provides a set of SWOT matrix in which should be recorded and then compared the strengths and weaknesses of the enterprise and the market opportunities and threats. This comparison allows you to determine what steps can be taken for the development of your company and what problems need to be addressed urgently.

SWOT Template

The "SWOT Analysis" solution gives simple visual support for all the steps of a SWOT Analysis process. SWOT analysis is a strategic planning method used to evaluate the Strengths, Weaknesses, Opportunities, and Threats facing a project. The new template for ConceptDraw MINDMAP isually supports identifying internal and external factors that are favorable and unfavorable. When the analysis is complete, output your data to a SWOT Matrix in ConceptDraw DIAGRAM for exporting to a variety of other formats: MS Visio, PowerPoint presentation, PDF, image files, etc.

SWOT analysis, TOWS analysis SWOT Analysis

SWOT analysis, TOWS analysis
SWOT and TOWS Matrix Diagrams solution extends ConceptDraw DIAGRAM and ConceptDraw MINDMAP software with features, templates, samples and libraries of vector stencils for drawing SWOT and TOWS analysis matrices and mind maps.

SWOT analysis, TOWS analysis SWOT and TOWS Matrix Diagrams

SWOT analysis, TOWS analysis
SWOT and TOWS Matrix Diagrams solution extends ConceptDraw DIAGRAM and ConceptDraw MINDMAP software with features, templates, samples and libraries of vector stencils for drawing SWOT and TOWS analysis matrices and mind maps.

marketing, process, chart, Marketing Charts, Marketing Diagrams,  solution park Marketing

marketing, process, chart, Marketing Charts, Marketing Diagrams,  solution park
This solution extends ConceptDraw DIAGRAM and ConceptDraw MINDMAP with Marketing Diagrams and Mind Maps (brainstorming, preparing and holding meetings and presentations, sales calls).
HelpDesk

How to Make an Ansoff Matrix Template

Ansoff Matrix is a business strategic management tool that helps a business determine its product and market growth strategy. Ansoff matrix has four sections to show each impacting ways that businesses can grow. Using the Ansoff Matrix enables determining the current position of any business in the industry and choose the direction of its growth, which would provide the most competitive position. While Ansoff Matrix is most commonly used as a business planning tool it can be used also for personal development. You can make the Ansoff Matrix template for your organization using ConceptDraw DIAGRAM Matrices solution.

interactive voice response system, IVR Interactive Voice Response Diagrams

interactive voice response system, IVR
Interactive Voice Response Diagrams solution extends ConceptDraw DIAGRAM software with samples, templates and libraries of ready-to-use vector stencils that help create Interactive Voice Response (IVR) diagrams illustrating in details a work of interactive voice response system, the IVR system’s logical and physical structure, Voice-over-Internet Protocol (VoIP) diagrams, and Action VoIP diagrams with representing voice actions on them, to visualize how the computers interact with callers through voice recognition and dual-tone multi-frequency signaling (DTMF) keypad inputs.

Pyramid Chart Examples

Seeking a solution for maximizing the efficiencies throughout the pyramid charts? ConceptDraw examples to help you create pyramid diagrams quickly.

?Management Diagrams, Matrixes, Organizational Charts, decision making, scheduling, thinking ideas, problem solving, business planning, company organizing, SWOT analysis Management

?Management Diagrams, Matrixes, Organizational Charts, decision making, scheduling, thinking ideas, problem solving, business planning, company organizing, SWOT analysis
This solution extends ConceptDraw DIAGRAM and ConceptDraw MINDMAP with Management Diagrams and Mind Maps (decision making, scheduling, thinking ideas, problem solving, business planning, company organizing, SWOT analysis, preparing and holding meetings

ConceptDraw DIAGRAM Comparison with Omnigraffle Professional and MS Visio

ConceptDraw DIAGRAM Comparison with Omnigraffle Professional and MS Visio. All source ConceptDraw documents are vector graphic documents. They are available for reviewing, modifying, or converting to a variety of formats: PDF file, MS PowerPoint, MS Visio, and many other graphics formats.

Business Process Workflow Diagram

Business Process Workflow Diagram is a professional visual tool that is widely applied for business development, business analysis, business process optimization and documenting business processes. Business Process Workflow Diagram lets depict in details the steps of business processes and flow of tasks between them, the execution of business processes, transfer of data and documents.
The workflows on the Business Process Workflow Diagram are represented using the set of common symbols which let easy illustrate business processes and process flows, depict the start, all major steps and end of the process, what data are used by the process, how the data flow through the business areas within scope of our project, how the tasks are executed and by who, and how workers interact with each other.
How to Draw Business Process Diagrams
HelpDesk

How to Create a Fault Tree Analysis Diagram (FTD)

Fault Tree Diagram is a logic diagram that shows the state of an entire system in a relationship of the conditions of its elements. Fault Tree Diagram is used to analyze the probability of functional system failures and safety accidents. ConceptDraw DIAGRAM allows you to create professional Fault Tree Diagrams using the basic FTD symbols. An FTD visualizes a model of the processes within a system that can lead to the unlikely event. A fault tree diagrams are created using standard logic symbols. The basic elements in a fault tree diagram are gates and events.
HelpDesk

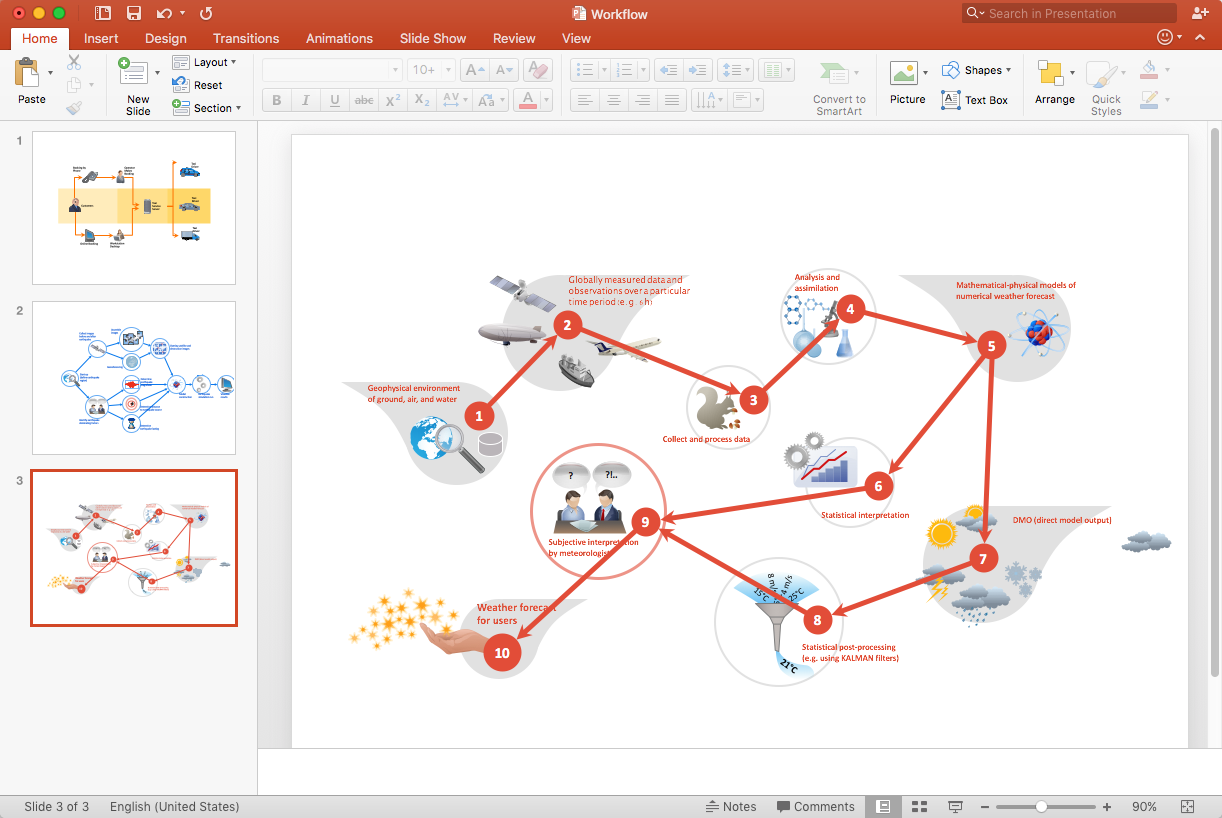
How to Add a Workflow Diagram to a PowerPoint Presentation

Making workflow diagrams in PowerPoint can help to describe the process within your organization as well as making comprehensive analysis presentations for sales or management and also can be used in other presentations and business documentation.