"In software engineering, software system safety optimizes system safety in the design, development, use, and maintenance of software systems and their integration with safety-critical hardware systems in an operational environment." [Software system safety. Wikipedia]
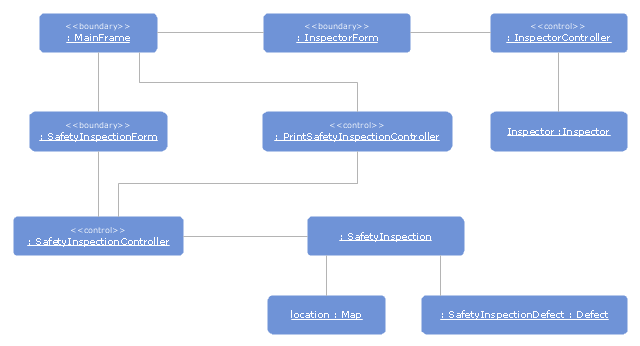
The UML object diagram example "Safety inspection" was created using the ConceptDraw PRO diagramming and vector drawing software extended with the Rapid UML solution from the Software Development area of ConceptDraw Solution Park.
The UML object diagram example "Safety inspection" was created using the ConceptDraw PRO diagramming and vector drawing software extended with the Rapid UML solution from the Software Development area of ConceptDraw Solution Park.
UML object diagram
Fire Exit Plan. Building Plan Examples

 Safety and Security
Safety and security solution extends ConceptDraw DIAGRAM software with illustration samples, templates and vector stencils libraries with clip art of fire safety, access and security equipment.
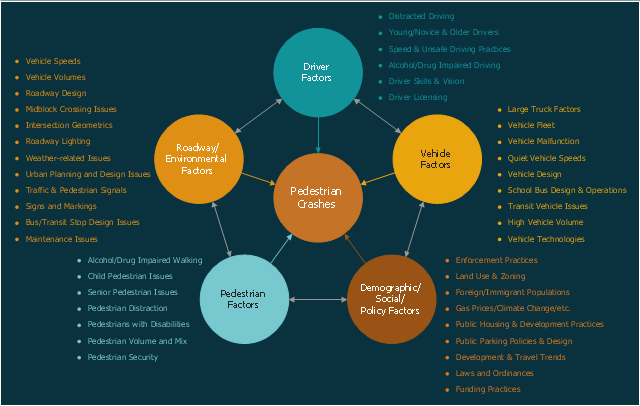
This circle-spoke diagram sample shows the factors related to pedestrian safety and morbidity. It was designed on the base of the figure 3 on the webpage "Pedestrian Safety Strategic Plan: Recommendations for Research and Product Development" from the website of the Federal Highway Administration (FHWA) of the U.S. Department of Transportation (DOT).
"Based on the data analysis and literature review, there are a wide variety of factors which contribute to the likelihood of a pedestrian crash. These include factors related to such categories as pedestrians (e.g., pedestrian age, behavior), drivers (e.g., driver distraction), vehicles (e.g., large trucks), roadway environment (e.g., vehicle speeds and volumes, roadway and intersection design), as well as demographic, social, and policy factors (e.g., land use and zoning practices). Some of the primary factors within each of these five categories are given in Figure 3."
[safety.fhwa.dot.gov/ ped_ bike/ pssp/ fhwasa10035/ ]
The hub-and-spoke diagram example "Factors related to pedestrian safety and morbidity" was created using the ConceptDraw PRO diagramming and vector drawing software extended with the Circle-Spoke Diagrams solution from the area "What is a Diagram" of ConceptDraw Solution Park.
Circle-spoke diagram
This arrow loop diagram sample was created on the base of the figure illustrating the webpage "Safe Roads for a Safer Future A Joint Safety Strategic Plan" from the website of US Department of Transportation - Federal Highway Administration (FHWA) Office of Safety.
"STRATEGIC PLANNING CYCLE.
After the safety units issue the SSP, they will identify and prioritize strategies to support the established goals. Many strategies will originate in existing roadmaps or in other program planning activities. The safety units will also use this information when developing their Unit Performance Plans and individual performance plans. Teams within each safety unit will carry out projects and activities to support identified strategies and achieve the SSP goals.
The SSP process also includes continuous performance monitoring and evaluation through which the safety units will review past accomplishments against the established goals, consider how well strategies are implemented, assess progress toward goals, identify risks, consider changes in the environment, and discuss future strategic direction. As a part of the evaluation process, the three safety units will recognize achievements and discuss the need for adjustments. Figure ... shows the strategic planning cycle.
The safety units will update the SSP every 3 to 5 years using input from a variety of sources, including evaluations, safety trends, and legislative changes." [safety.fhwa.dot.gov/ ssp/ ]
The arrow loop diagram example "Strategic planning cycle" was created using the ConceptDraw PRO diagramming and vector drawing software extended with the Target and Circular Diagrams solution from the Marketing area of ConceptDraw Solution Park.
www.conceptdraw.com/ solution-park/ marketing-target-and-circular-diagrams
Arrow loop diagram
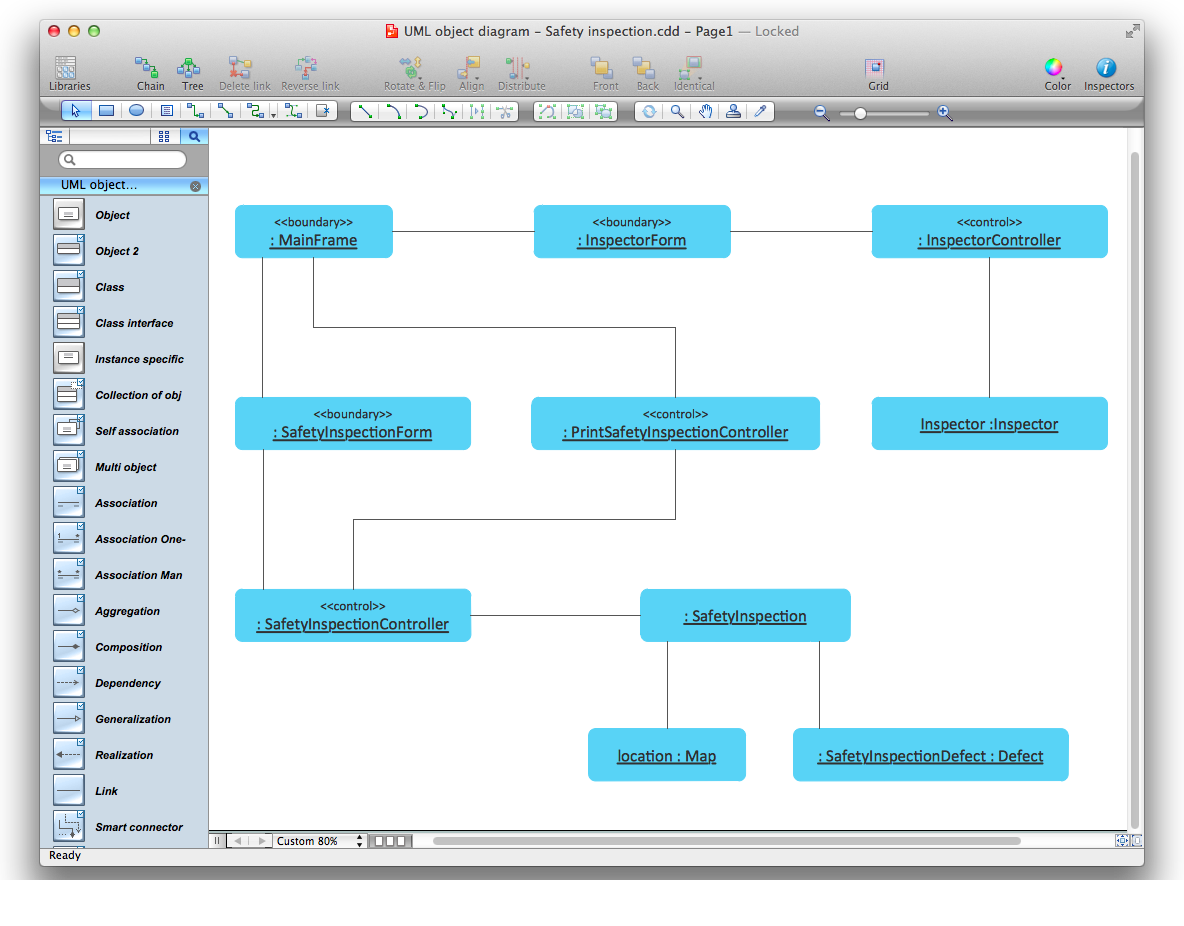
Diagramming Software for Design UML Object Diagrams

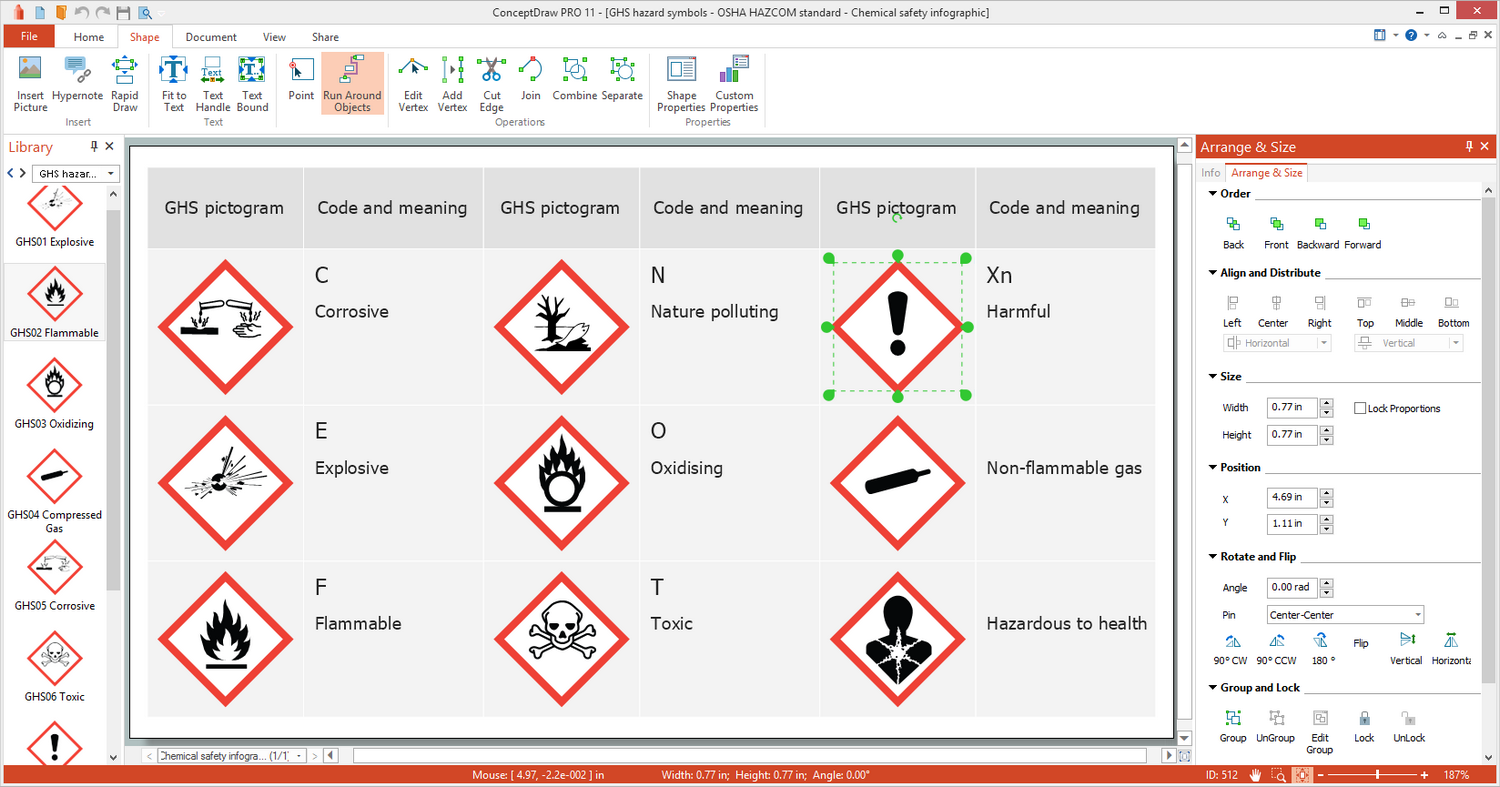
GHS Labels Meanings
Emergency Plan


 Fishbone Diagrams
The Fishbone Diagrams solution extends ConceptDraw DIAGRAM software with the ability to easily draw the Fishbone Diagrams (Ishikawa Diagrams) to clearly see the cause and effect analysis and also problem solving. The vector graphic diagrams produced using this solution can be used in whitepapers, presentations, datasheets, posters, and published technical material.
Visual Presentations Made Easy with Diagramming Software


- Diagram Of Safety Equipment
- Fire Safety Diagram
- Fishbone Diagram Product Safety Example
- Safety Precaution Image And Diagram
- Level Diagram Structure Of Safety Department
- Fire and Emergency Plans | Emergency Plan | Fire safety equipment ...
- UML object diagram - Safety inspection | Software Development ...
- Safety and Security | Safety Protection Equipment Image With Diagram
- Level Diagram Of Safety Department
- Safety and Security | Safety