HelpDesk
How To Create Root Cause Analysis Diagram Using ConceptDraw Office
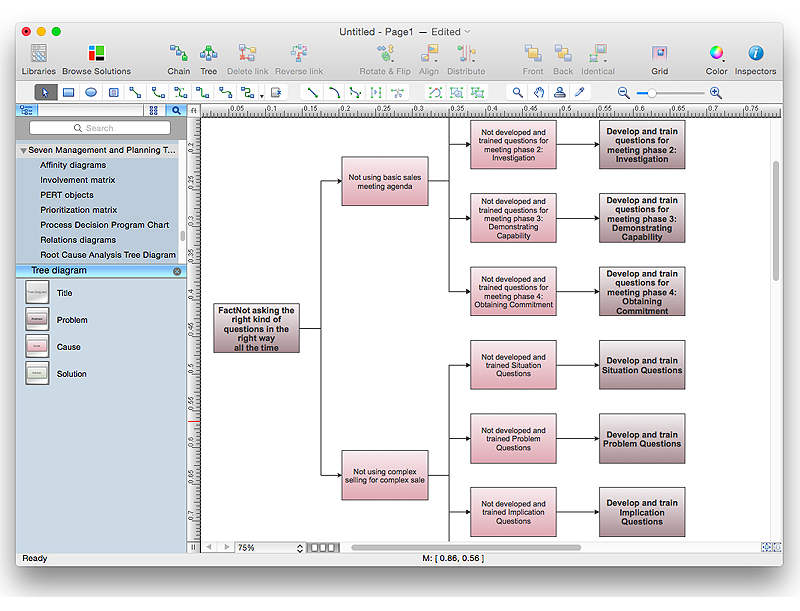
Root Cause Analysis (RCA) is used to determine the main causes of the problem. If the certain factor is the root cause, this mean that its vanishing will help to prevent the further recurrence of the problem. Root Cause Analysis diagram is used to analyze the root causes of factors that influence the problem. It helps to identify the root causes for a factor and then propose possible corrective actions. A diagram is constructed separately for each high priority factor. The ability to create a RCA tree diagram from a mind map is supported by the ConceptDraw Seven Management and Planning Tools solution.HelpDesk
How to Manage Problem Solving Using Seven Management and Planning Tools
Stage by stage gouide on using visual tools to move toward solving the problem.
HelpDesk
What Makes ConceptDraw PRO the Best Alternative to MS Visio®
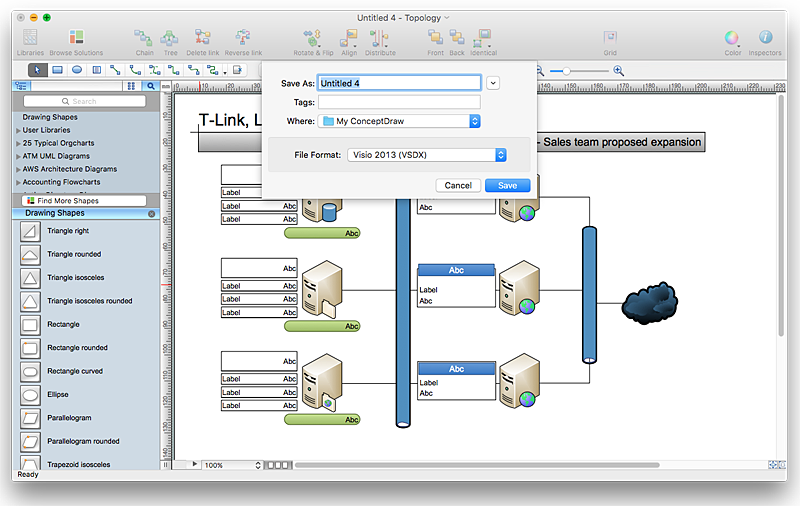
If you are looking for an intelligent diagramming tool alternative to Microsoft Visio, no matter for Windows or OS X , ConceptDraq PRO is the best option. Drawing any type business diagrams, various technical schemes and even mind maps is what ConcepDraw PRO is an expert. You can easy get started on any diagram of your choice and complete it perfectly and quickly. With the extensive collection of templates, samples and vector object libraries ConcepDraw PRO lets you draw the way most preferable for you. ConceptDraw PRO is the best Microsoft Visio alternative: it's simpler to use, less expensive, and supports project management and mindmapping techniques. ConceptDraw PRO enables you to visualize information and processes cost- and effort effectively.
 Management Area
The solutions from Management area of ConceptDraw Solution Park collect templates, samples and libraries of vector stencils for drawing the management diagrams and mind maps.
 Seven Basic Tools of Quality
Manage quality control in the workplace, using fishbone diagrams, flowcharts, Pareto charts and histograms, provided by the Seven Basic Tools of Quality solution.
 ConceptDraw Solution Park
ConceptDraw Solution Park collects graphic extensions, examples and learning materials
- Root cause analysis tree diagram template | Fault Tree Diagram ...
- Lean Manufacturing Diagrams | Root cause analysis tree diagram ...
- Process Flowchart | Fault Tree Analysis Diagrams | How To Create ...
- Cause & Effect Analysis | Process Flowchart | Business Productivity ...
- Cross-Functional Flowchart | Influence Diagram | Influence Diagram ...
- Decision tree diagram | Decision Making | Influence Diagram ...
- CORRECTIVE ACTIONS PLANNING Risk Diagram (PDPC) | Cross ...
- Root cause analysis tree diagram - Personal problem solution | Root ...
- UML composite structure diagram - Sale process | Root cause ...
- How To Create Root Cause Analysis Diagram | Types of Flowcharts ...
- Sample Flow Chart In Account Analysis
- Project —Task Trees and Dependencies | Decision Making ...
- Root cause analysis tree diagram - Manufacturing problem solution ...
- Flowchart Analysis Types
- Cause and Effect Analysis (Fishbone Diagrams) | PROBLEM ...
- Seven Management and Planning Tools | Process Flowchart | Total ...
- CORRECTIVE ACTIONS PLANNING PERT Chart | CORRECTIVE ...
- Seven Management and Planning Tools | Root cause analysis tree ...
- Fault Tree Analysis Diagrams | Seven Management and Planning ...
- Seven Management and Planning Tools | Root cause analysis tree ...


