The vector stencils library "Management pictograms" contains 72 management pictograms.
Use it to create your management infogram in the ConceptDraw PRO diagramming and vector drawing software.
The flat icons example "Management pictograms - Vector stencils library" is included in the solution "Marketing infographics" from the "Business infographics" area of ConceptDraw Solution Park.
Use it to create your management infogram in the ConceptDraw PRO diagramming and vector drawing software.
The flat icons example "Management pictograms - Vector stencils library" is included in the solution "Marketing infographics" from the "Business infographics" area of ConceptDraw Solution Park.
Accounting management

Activity

Audit management

Board of directors

Budget

Business managemen

Business management tools

Business model

Commanding

Communication

Company

Contract management

Controlling

Coordinating

Core competencies

Corporate strategy

Creativity

Crisis management

Crisis management 2

Decision making

Environmental management

Expenses

External environment

Financial management

Financial management 2

Financial planning

First-level manager

Goal

HR management

Investment management

IT management

Knowledge management

Knowledge management 2

Leadership

Macro environment

Management system

Managerial accounting

Manufacturing management

Market orientation

Marketing management

Marketing strategy

Middle-level manager

Mission

Objectives

Operations management

Organizing

Performance

Performance management

Planning

Policy

PR management

Problem solving

Process management

Product management

Profit

Profit 2

Project management

Quality management

Research and development

Resource management

Resources

Risk management

Sales manegment

Service management

Stakeholder management

Strategic management

Strategic planning

Technology management

Time frame

Time management

Top-level manager

Vision

The vector stencils library "Business" contains 24 business icons.
Use it to design your business and finance illustrations and infographics with ConceptDraw PRO diagramming and vector drawing software.
The vector stencils library "Business" is included in the Business and Finance solution from the Illustration area of ConceptDraw Solution Park.
Use it to design your business and finance illustrations and infographics with ConceptDraw PRO diagramming and vector drawing software.
The vector stencils library "Business" is included in the Business and Finance solution from the Illustration area of ConceptDraw Solution Park.
Company

Office branch

Bank

Income

Exchange

Business statistics

Mechanism

Commerce

Handshake

Business contract

Reporting

Risk

Targeting

Key to success

Transcontinental corporation

Credit debt

Taxes
Bankruptcy

Money case

ATM

Cash register

Buying

Exhibition

Delivery

The vector stencils library "Management pictograms" contains 72 management pictograms.
Use it to create your management infogram in the ConceptDraw PRO diagramming and vector drawing software.
The flat icons example "Management pictograms - Vector stencils library" is included in the solution "Marketing infographics" from the "Business infographics" area of ConceptDraw Solution Park.
Use it to create your management infogram in the ConceptDraw PRO diagramming and vector drawing software.
The flat icons example "Management pictograms - Vector stencils library" is included in the solution "Marketing infographics" from the "Business infographics" area of ConceptDraw Solution Park.
Accounting management
Activity
Audit management
Board of directors
Budget
Business managemen
Business management tools
Business model
Commanding
Communication
Company
Contract management
Controlling
Coordinating
Core competencies
Corporate strategy
Creativity
Crisis management
Crisis management 2
Decision making
Environmental management
Expenses
External environment
Financial management
Financial management 2
Financial planning
First-level manager
Goal
HR management
Investment management
IT management
Knowledge management
Knowledge management 2
Leadership
Macro environment
Management system
Managerial accounting
Manufacturing management
Market orientation
Marketing management
Marketing strategy
Middle-level manager
Mission
Objectives
Operations management
Organizing
Performance
Performance management
Planning
Policy
PR management
Problem solving
Process management
Product management
Profit
Profit 2
Project management
Quality management
Research and development
Resource management
Resources
Risk management
Sales manegment
Service management
Stakeholder management
Strategic management
Strategic planning
Technology management
Time frame
Time management
Top-level manager
Vision
Risk Positioning Diagram

The Best Flowchart Software Available


How To Make a Concept Map

"Process Decision Program Chart (PDPC).
A useful way of planning is to break down tasks into a hierarchy, using a tree diagram. The PDPC extends the tree diagram a couple of levels to identify risks and countermeasures for the bottom level tasks. Different shaped boxes are used to highlight risks and identify possible countermeasures (often shown as 'clouds' to indicate their uncertain nature). The PDPC is similar to the Failure Modes and Effects Analysis (FMEA) in that both identify risks, consequences of failure, and contingency actions; the FMEA also rates relative risk levels for each potential failure point." [Seven Management and Planning Tools. Wikipedia]
The Risk diagram (process decision program chart, PDPC) determines the risks when corrective action is not performed correctly. Also, it helps develop descriptions for preventive actions at the level of execution.
The Risk diagram (PDPC) template for the ConceptDraw PRO diagramming and vector drawing software is included in the solution "Seven Management and Planning Tools" from the Management area of ConceptDraw Solution Park.
Risk diagram
---template.png--diagram-flowchart-example.png)
Risk Diagram (Process Decision Program Chart)
")
PDPC

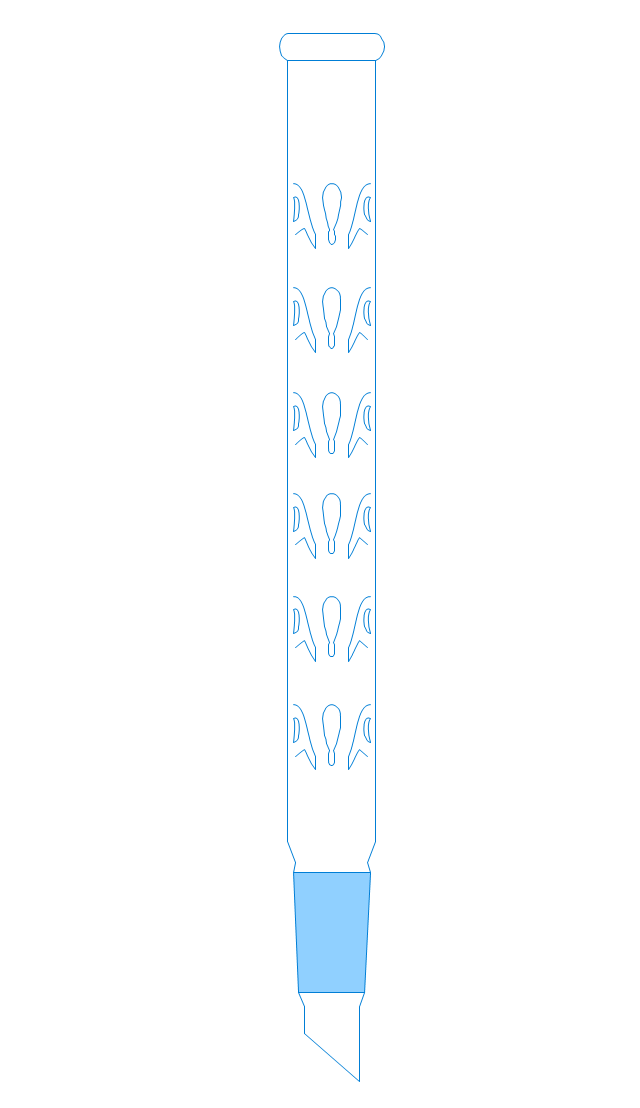
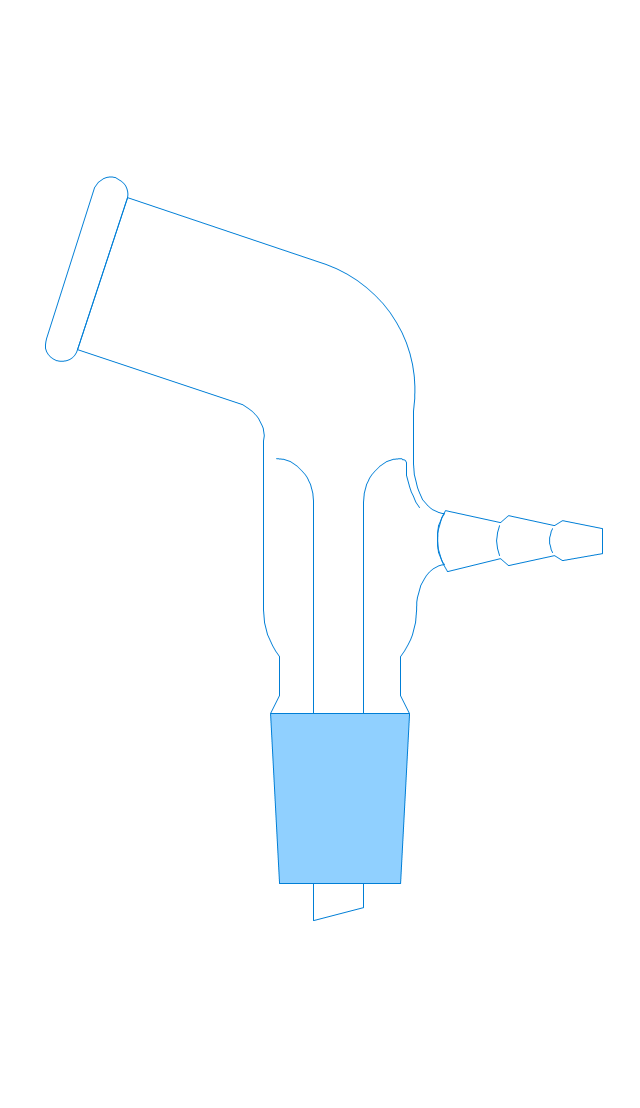
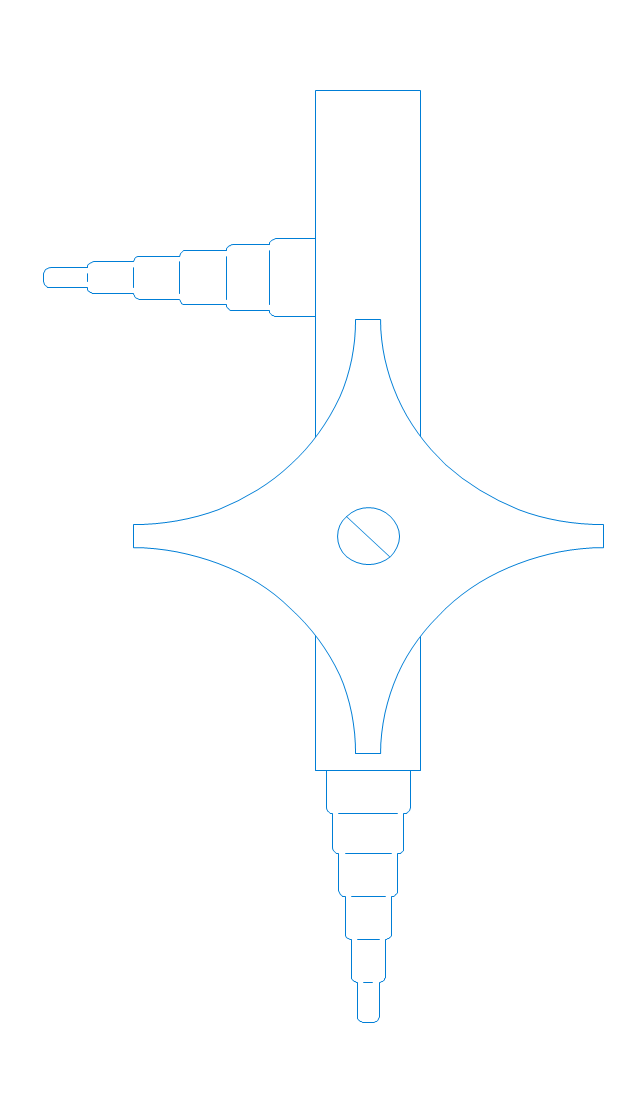
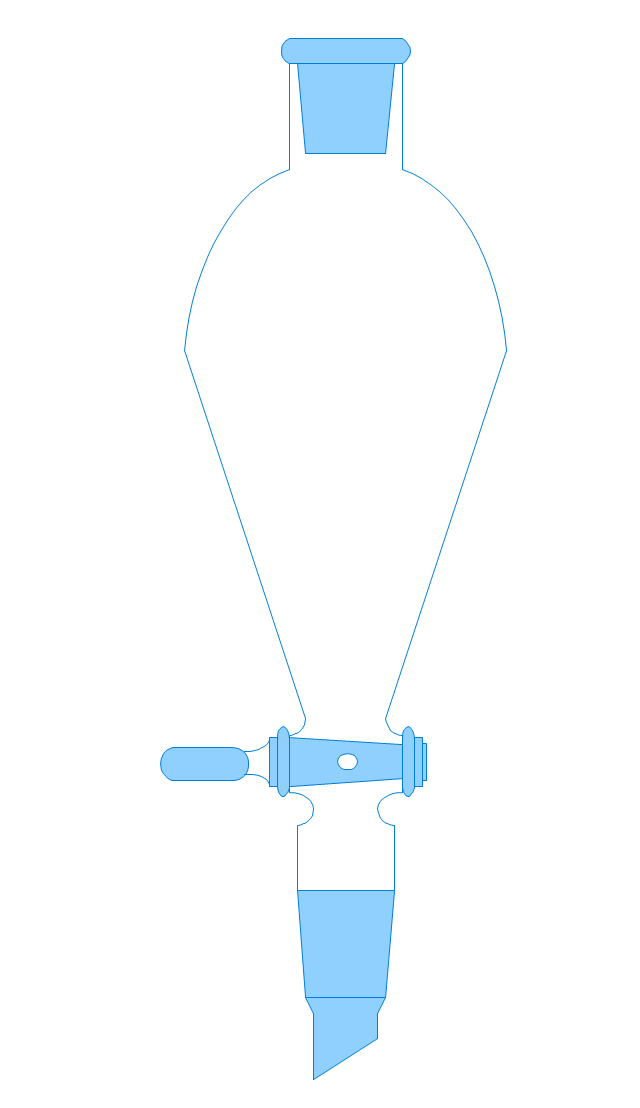
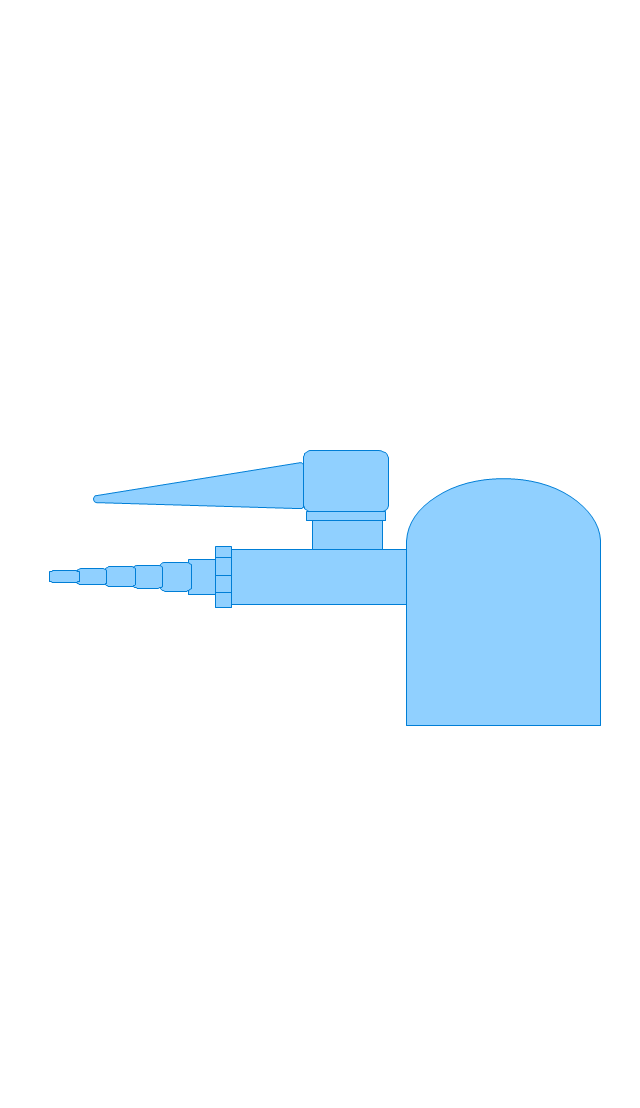
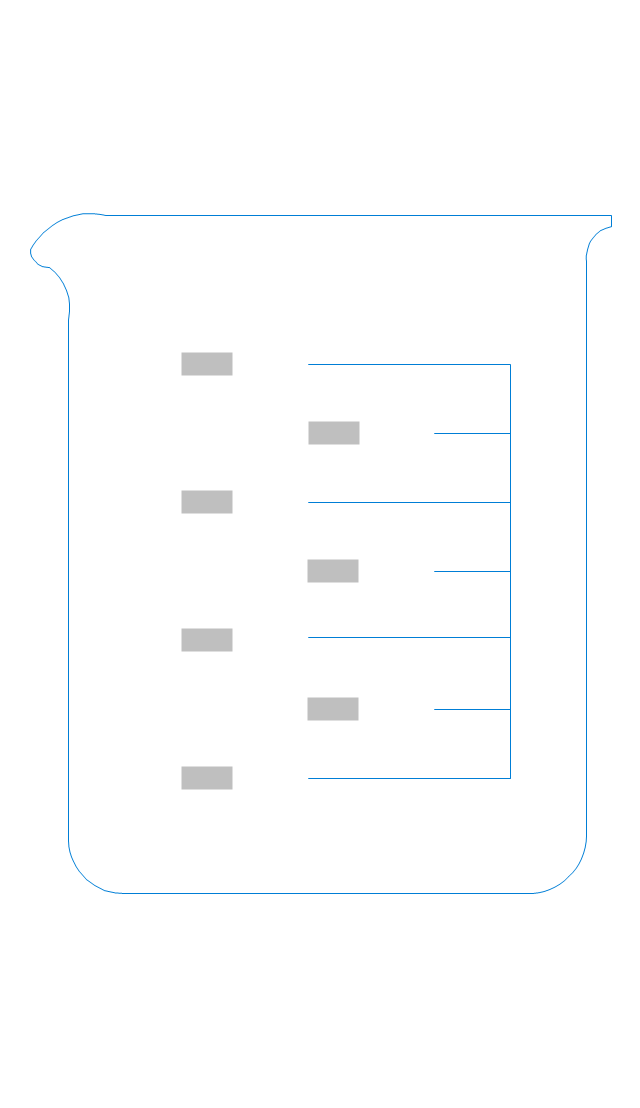
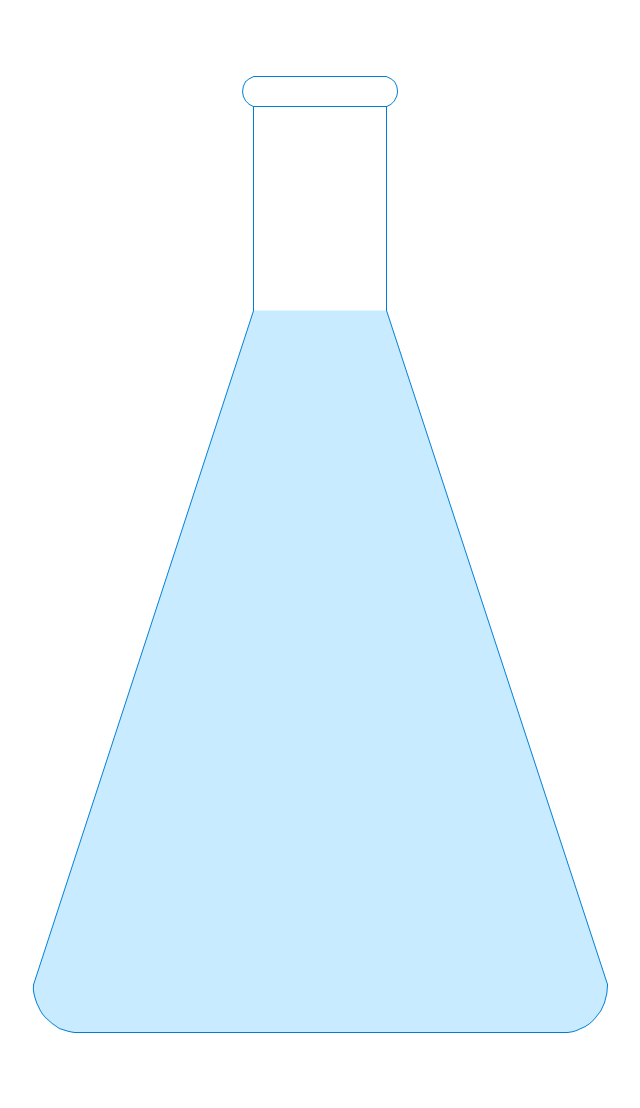
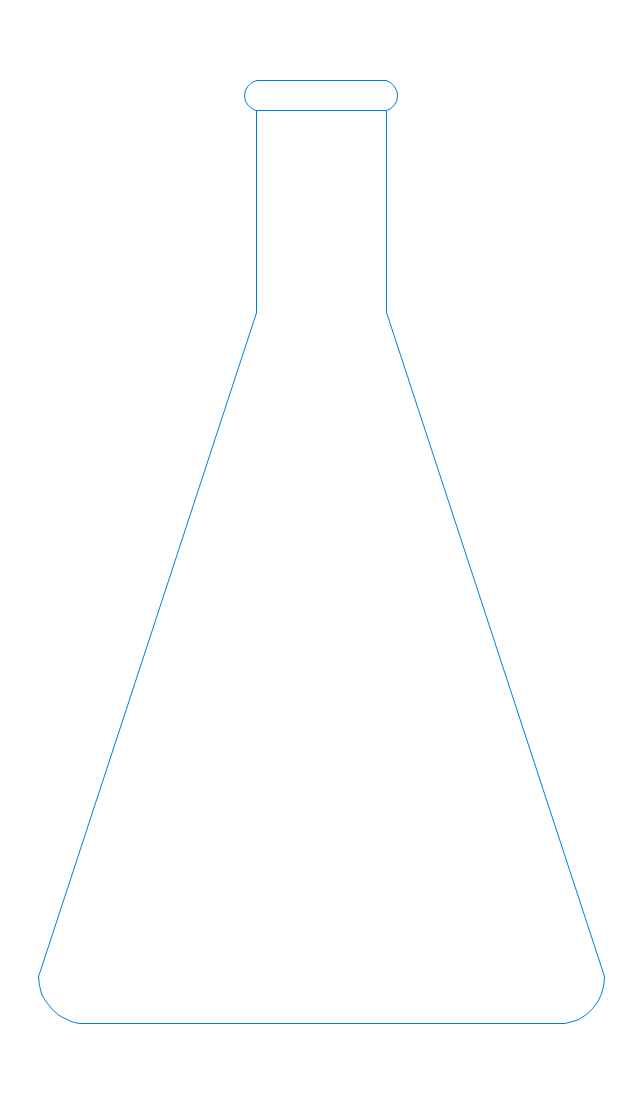
The vector stencils library "Laboratory equipment" contains 31 clipart icons of chemical laboratory equipment and labware.
Use these shapes for drawing part assembly and mounting schemes of glassware apparatus in chemical experiment diagrams and illustrations in the ConceptDraw PRO diagramming and vector drawing software extended with the Chemistry solution from the Science and Education area of ConceptDraw Solution Park.
Use these shapes for drawing part assembly and mounting schemes of glassware apparatus in chemical experiment diagrams and illustrations in the ConceptDraw PRO diagramming and vector drawing software extended with the Chemistry solution from the Science and Education area of ConceptDraw Solution Park.
Vigreux distillation column
Hirsch funnel
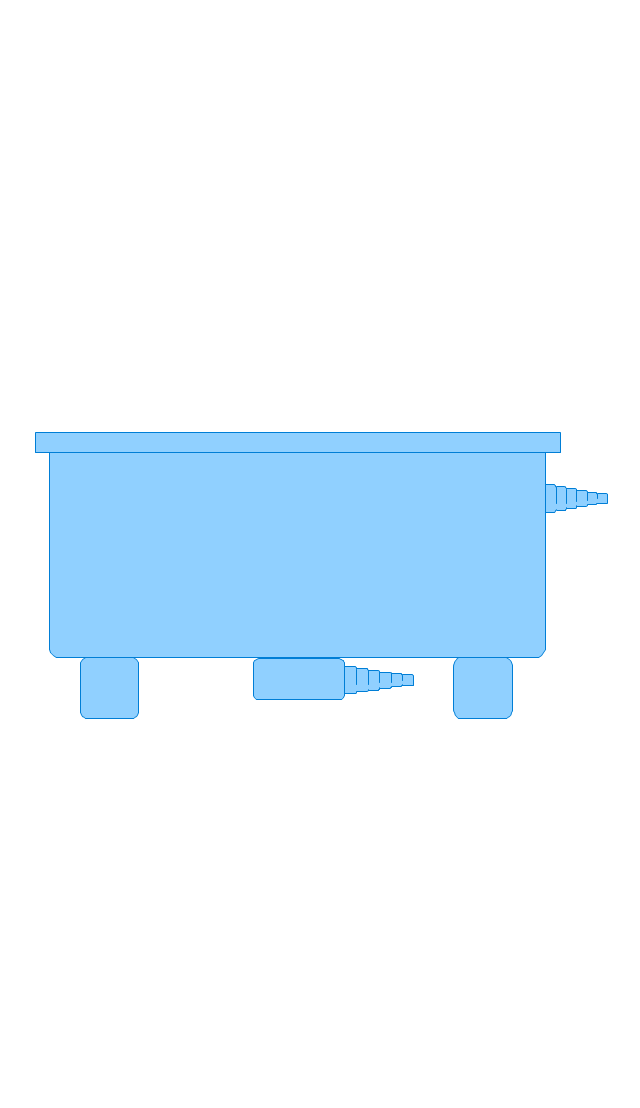
Oil bath

Steam bath
Thermometer

Tap (valve)
--laboratory-equipment---vector-stencils-library.png--diagram-flowchart-example.png)
Vacuum adaptor
Liebig condenser (long)
-laboratory-equipment---vector-stencils-library.png--diagram-flowchart-example.png)
Liebig condenser (short)
-laboratory-equipment---vector-stencils-library.png--diagram-flowchart-example.png)
Water faucet
Büchner flask

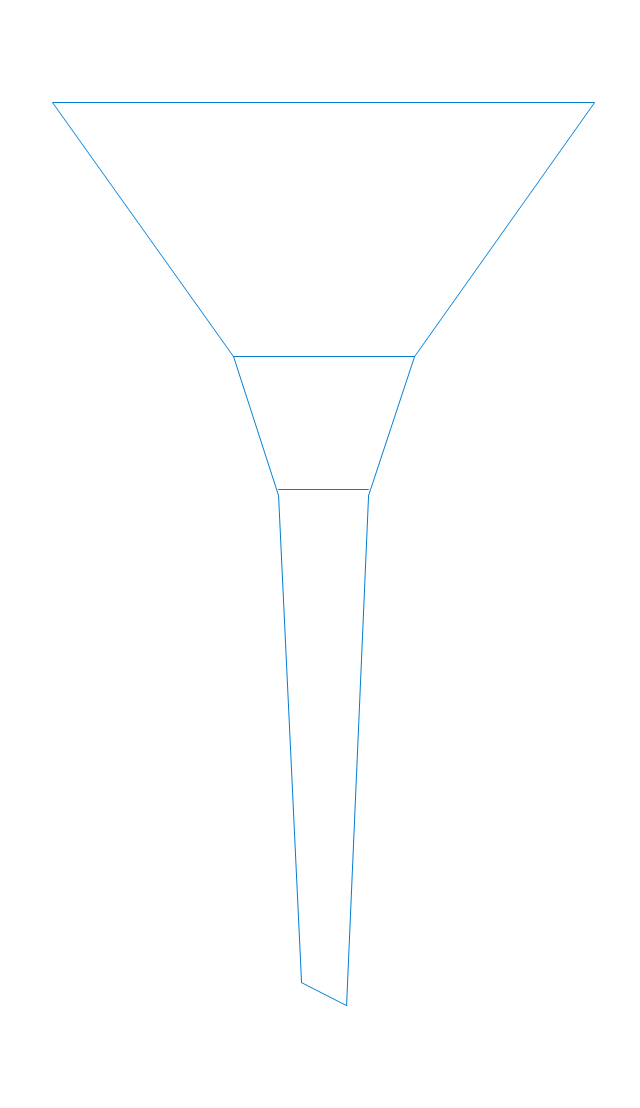
Stemless funnel
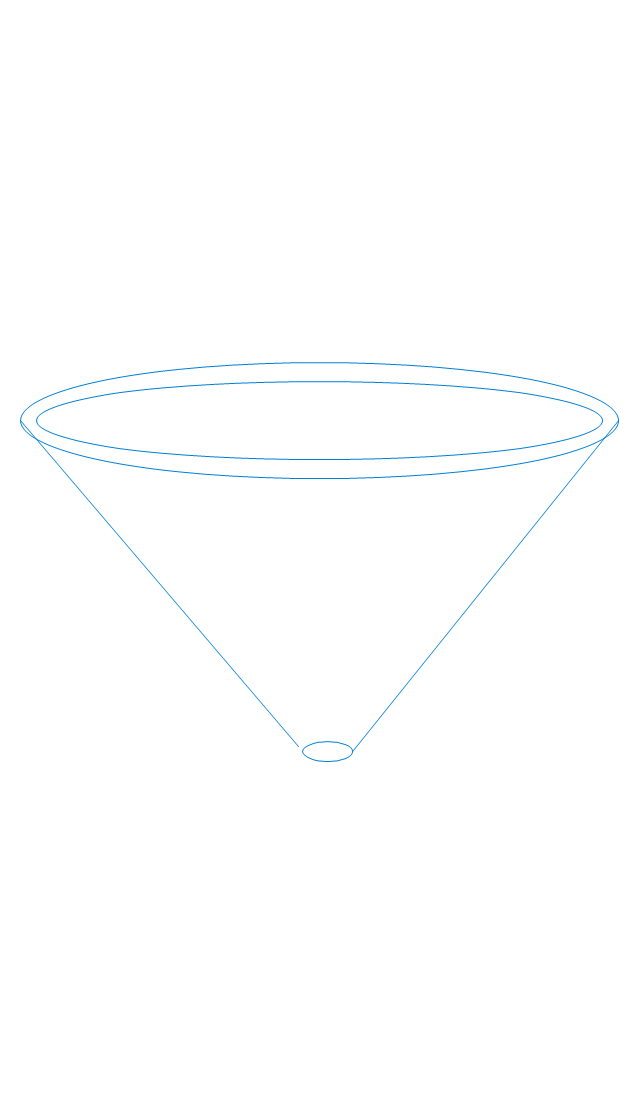
Stemmed funnel

Separatory funnel
Heating mantle

Hot plate

Gas tap
Folded filter paper

Y-Adaptor
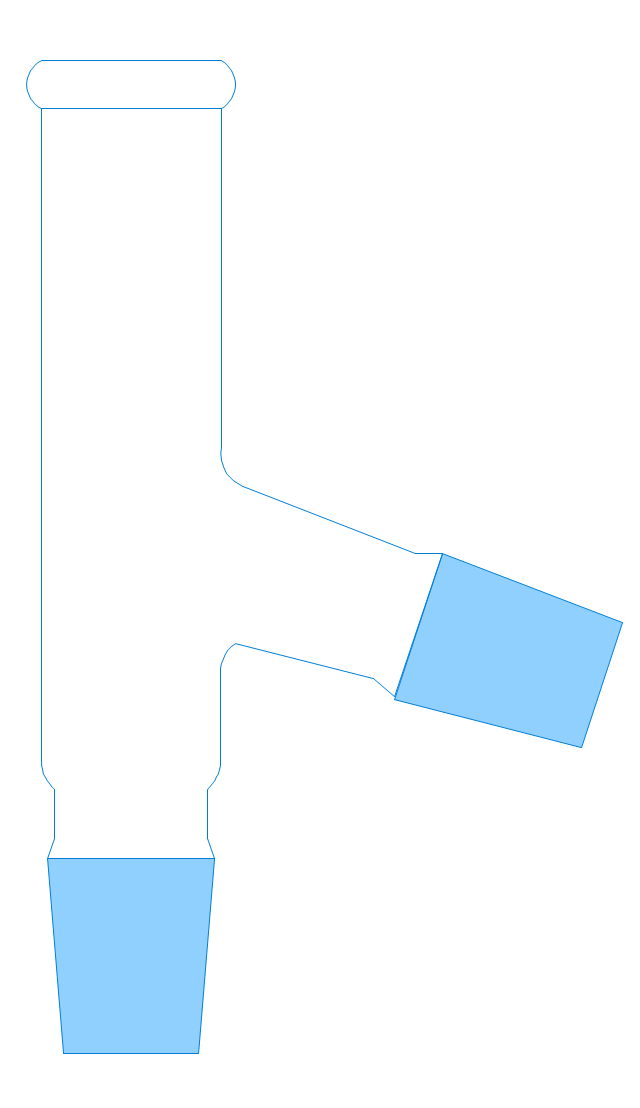
Claisen adapter

Bunsen burner

Büchner funnel

Erlenmeyer flask, 25ml

Round-bottom flask, 50ml

Round-bottom flask, 250ml

Beaker 100ml, filled
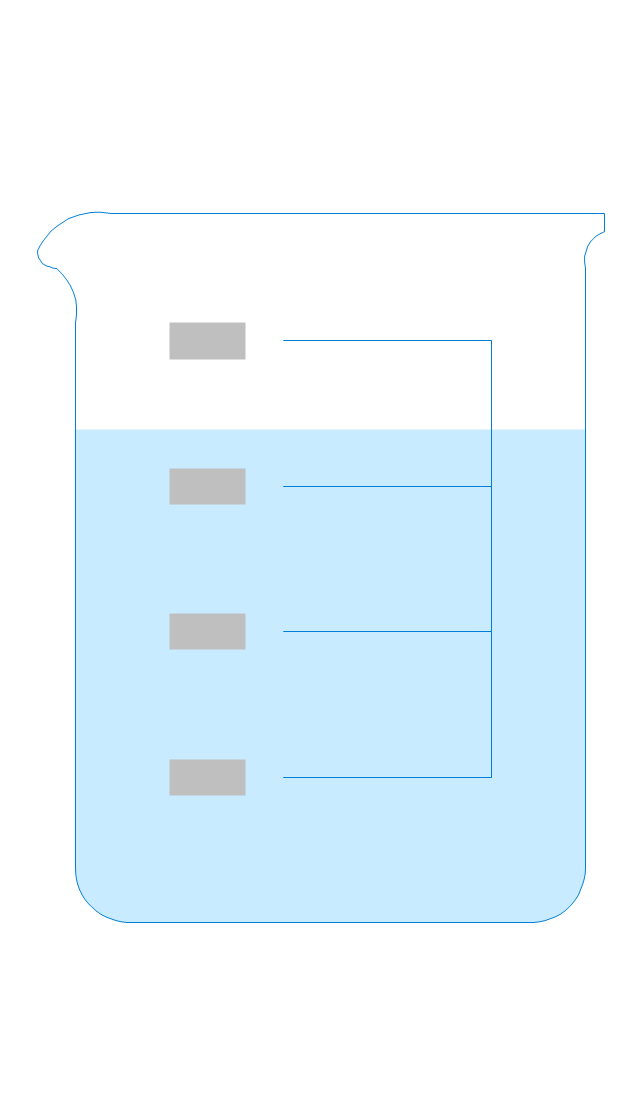
Beaker 100ml, empty

Beaker 500ml, filled
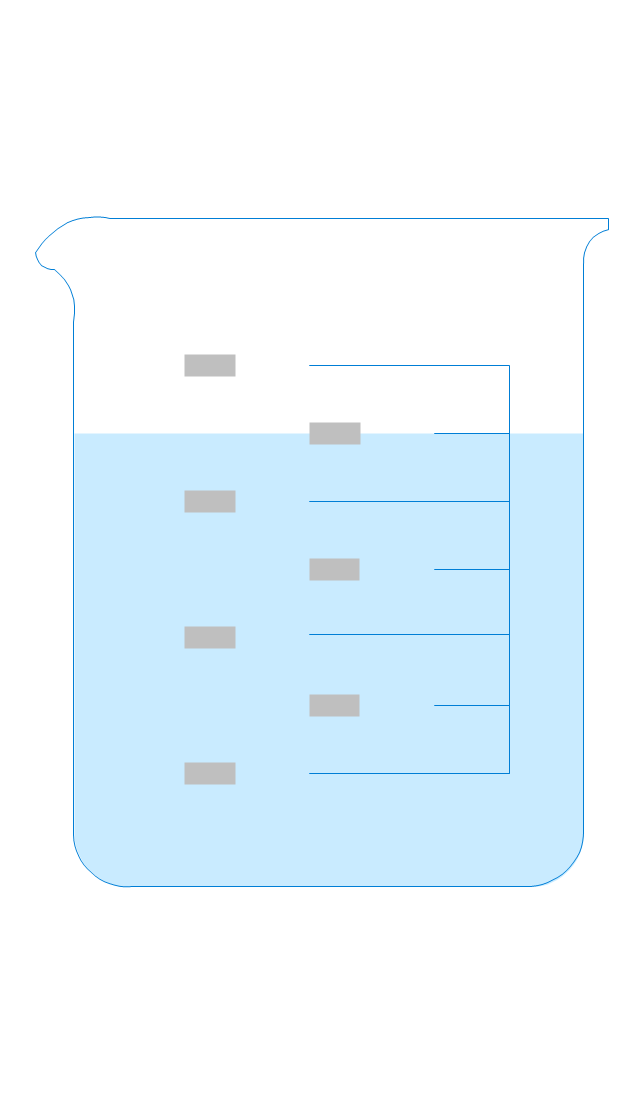
Beaker 500ml, empty
Erlenmeyer flask 250ml, filled
Erlenmeyer flask 250ml, empty
- Information Technology Risk Vector Png
- Risk Diagram (Process Decision Program Chart) | Create ...
- Management pictograms - Vector stencils library | How To Make a ...
- Management pictograms - Vector stencils library
- Actions Risk Mitigation Vector
- PDCA cycle | Report | Project management - Vector stencils library ...
- Vector Technology Png
- Business - Vector stencils library | Shake Hand Vector Png
- Sample Risk Management Plan Template Chart
- The Best Flowchart Software Available | Risk management ...