Planogram Software and Retail Plan Software

Example of DFD for Online Store (Data Flow Diagram)


Flow chart Example. Warehouse Flowchart


Flowchart on Bank. Flowchart Examples


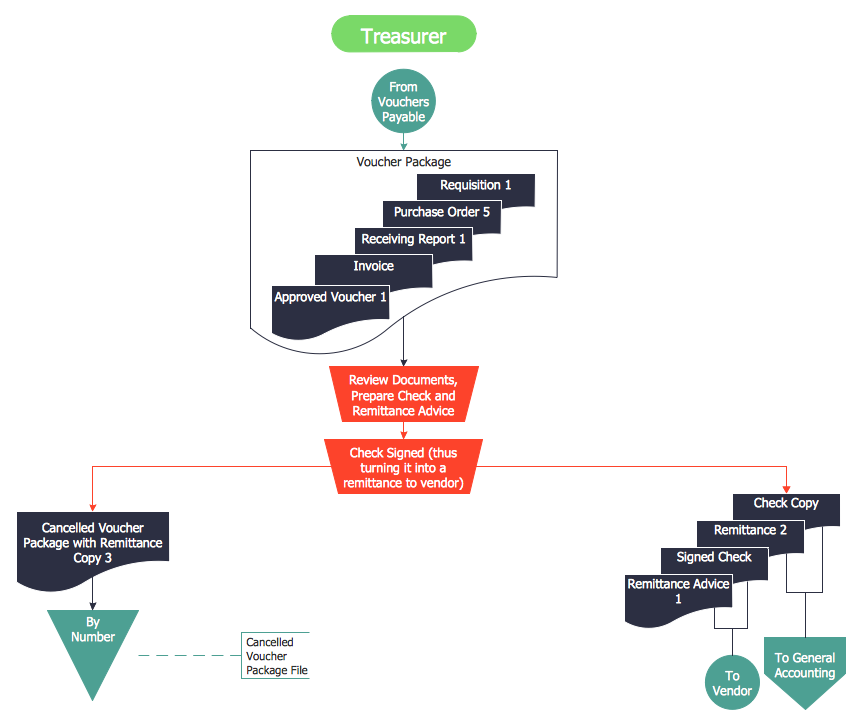
Accounts Payable Process Flow Chart
Project Timeline

 Business Process Mapping
The Business Process Mapping solution for ConceptDraw DIAGRAM is for users involved in process mapping and creating SIPOC diagrams.
Cross-Functional Flowchart


Purchase Process Flow Chart, Receiving Process Flow Chart, Accounting Flowchart Example.

Business Processes

- Retail Business Operation Process Flow Chart
- Business Process Flow Diagram | Flow chart Example. Warehouse ...
- Retail Process Flow Chart
- Workflow Diagram Of Business Retail
- Retail Merchandising Process Flow Chart
- Process Flow Of Accounts Payable In Retail Industry
- Business Process Mapping | Seven Management and Planning ...
- Fishbone Diagrams | Retail After Sales Service Process Flow Chart
- Flowcharts | Product Retail Process Flow Chart