The vector stencils library "Business people" contains 36 business people icons.
Use it to design your business and finance illustrations and infographics with ConceptDraw PRO diagramming and vector drawing software.
The vector stencils library "Business people" is included in the Business and Finance solution from the Illustration area of ConceptDraw Solution Park.
Use it to design your business and finance illustrations and infographics with ConceptDraw PRO diagramming and vector drawing software.
The vector stencils library "Business people" is included in the Business and Finance solution from the Illustration area of ConceptDraw Solution Park.
Board of directors

Negotiations

Business report

Conference

Speech

Round-table discussion

Presentation

Business meeting

International connections

Staff

Business team

Business link

Hierarchy

Employee male

Employee female

Manager

Shareholder

Customer

Leader

Investor

Boss chair

Partners

Organization

Team work

Salary allocation

HR management

Employed worker

Underloaded resource

Overdriven resource

Human resource

Available resource

Job vacancy

Staff search

Interview

Business man

Rally

The vector stencils library "Medicine and health pictograms" contains 20 icons of medical and healthcare symbols.
Use it to draw your medical and healthcare infographics.
The example "Medicine and health pictograms - Vector stencils library" was created using the ConceptDraw PRO diagramming and vector drawing software extended with the Pictorial infographics solution from the area "What is infographics" in ConceptDraw Solution Park.
Awareness ribbon

Cardiogram

Stethoscope

Calling an ambulance

Tooth

DNA

First aid

Syringe

Thermometer

Lungs

Medicament

Pills

Patch

Stomach

Hospital

Dropper

Glasses

Case report

Crutches

Pharmacy

The vector stencils library "Project management" contains 30 project management icons.
Use it to design your business and finance illustrations and infographics with ConceptDraw PRO diagramming and vector drawing software.
The vector stencils library "Project management" is included in the Business and Finance solution from the Illustration area of ConceptDraw Solution Park.
Use it to design your business and finance illustrations and infographics with ConceptDraw PRO diagramming and vector drawing software.
The vector stencils library "Project management" is included in the Business and Finance solution from the Illustration area of ConceptDraw Solution Park.
Start project

Project plan

Project scheme

To do list

Checklist

Project strategy

Timetable

Project time

Project fulfillment

Project Gantt chart

Project completed

Project report

Project management

Project descriptions

Communications

Project team

Project director

Project manager

Assignment of works

Project analyst

Project benefits

Failure to draw on the funds

Cost overrun

Cost

Project expenses

Portfolio

Ticket

Project task

Financial resources

Material resources

The vector stencils library "Management" contains 20 management icons.
Use it to design your business and finance illustrations and infographics
with ConceptDraw PRO diagramming and vector drawing software.
The vector stencils library "Management" is included in the Business and Finance solution from the Illustration area of ConceptDraw Solution Park.
Use it to design your business and finance illustrations and infographics
with ConceptDraw PRO diagramming and vector drawing software.
The vector stencils library "Management" is included in the Business and Finance solution from the Illustration area of ConceptDraw Solution Park.
Planning

Business trip

Internal investment

External investment

Income allocation

Preparation of documentation package

Report document

Credit in bank

Financial estimation

Juridical estimation

Calculation of power consumption

Expenses calculation

Form

Force majeure

Accounting per day

Accounting per week

Accounting per month

Accounting per quarter

Accounting per year

Summation

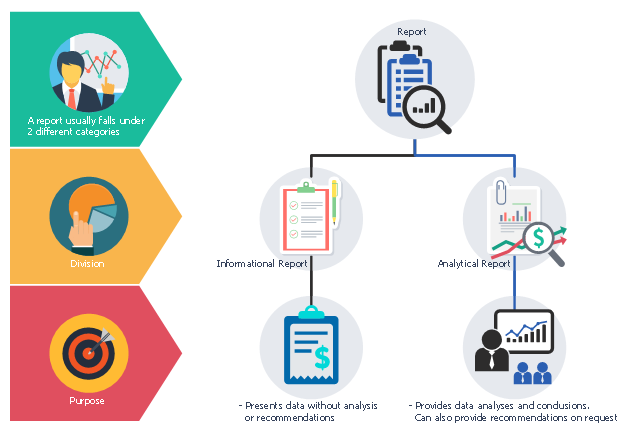
This business infographic sample shows the two types of report:
1. Informational report presents data without analysis or recommendations.
2. Analytical report provides data analyses and conclusions. Can also provide recommendations on request.
A report usually falls under 2 different categories: Division and Purpose.
This business infographic sample was designed on the base of the Wikimedia Commons file: Figure 12.1.png. [commons.wikimedia.org/ wiki/ File:Figure_ 12.1.png]
The business infographic example "Report" was designed using ConceptDraw PRO diagramming and vector drawing software extended with the Business and Finance solution from Illustration area of ConceptDraw Solution Park.
Infographic
Business Report Pie. Pie Chart Examples

Flow Chart Diagram Examples

Pyramid Diagram

HelpDesk
How to Publish Project Reports to a Web Site

How to Report Task's Execution with Gantt Chart
