This site uses cookies. By continuing to browse the ConceptDraw site you are agreeing to our Use of Site Cookies.

Pyramid Diagram

A four level pyramid model of different types of Information Systems based on the different levels of hierarchy in an organization.

3 Circle Venn Diagram. Venn Diagram Example

This template shows the Venn Diagram. It was created in ConceptDraw DIAGRAM diagramming and vector drawing software using the ready-to-use objects from the Venn Diagrams Solution from the "Diagrams" area of ConceptDraw Solution Park.
Venn Diagrams visualize all possible logical intersections between several sets and are widely used in mathematics, logic, statistics, marketing, sociology, etc.
HelpDesk

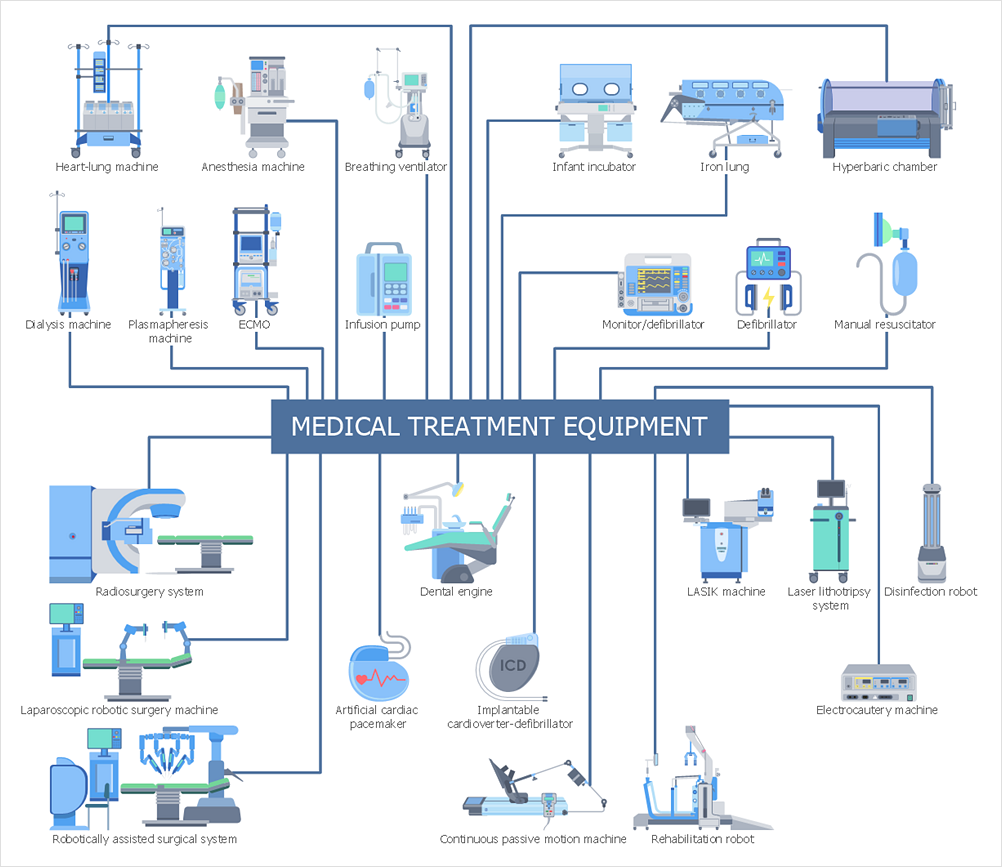
How to Design Effective Medical Illustrations
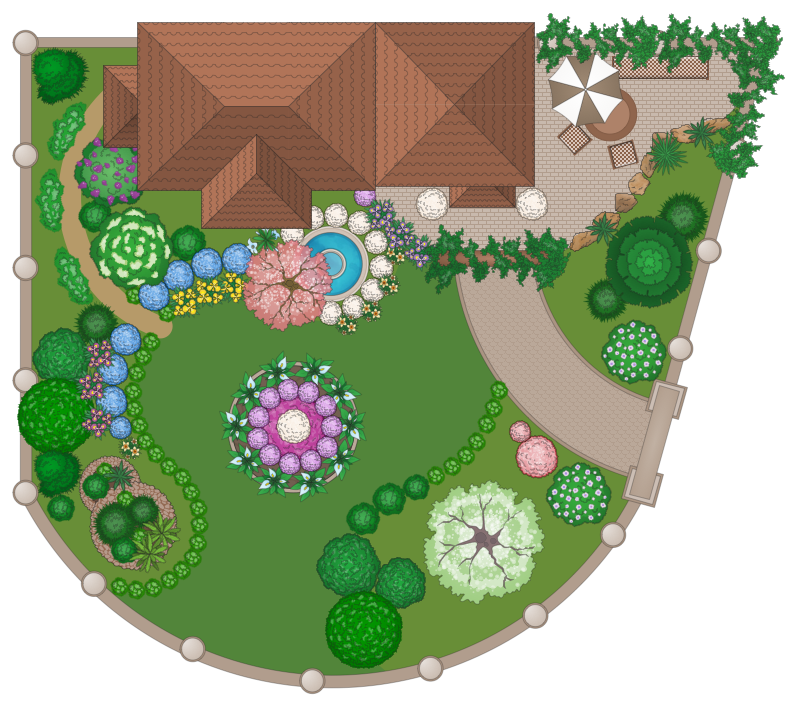
The Medical Illustrations solution extends abilities of ConceptDraw DIAGRAM software with an incredibly large variety of ready-to-use vector objects and icons that help to design professional-looking, colorful and attractive Medical illustrations, Medical diagrams and infographics, slides for presentations in a field of medicine and healthcare.

Landscape Plan

A landscape plan depicts all the features of a future garden including buildings, plants, lawns or a patio. Such plan is a very important part of site adjustment because it gives a complete picture of future project.
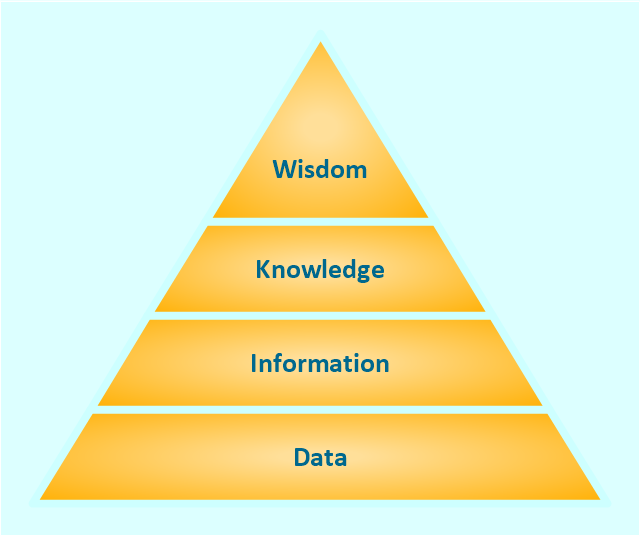
"The DIKW Pyramid, also known variously as the "DIKW Hierarchy", "Wisdom Hierarchy", the "Knowledge Hierarchy", the "Information Hierarchy", and the "Knowledge Pyramid", refers loosely to a class of models for representing purported structural and/ or functional relationships between data, information, knowledge, and wisdom. "Typically information is defined in terms of data, knowledge in terms of information, and wisdom in terms of knowledge"."
[DIKW Pyramid. Wikipedia]
This triangle diagram example of DIKW pyramid has 4 levels: data, information, knowledge and wisdom.
It redesigned using the ConceptDraw PRO diagramming and vector drawing software from Wikimedia Commons file DIKW-diagram.png. [commons.wikimedia.org/ wiki/ File:DIKW-diagram.png]
This file is licensed under the Creative Commons Attribution-Share Alike 3.0 Unported license. [creativecommons.org/ licenses/ by-sa/ 3.0/ deed.en]
The trianglular chart sample "Knowledge hierarchy triangle diagram" is included in the Pyramid Diagrams solution from the Marketing area of ConceptDraw Solution Park.
Pyramid diagram
Pyramid diagram, pyramid, triangle,

Fishbone Problem Solving

The knowledge and ability to apply various strategies for dealing with problems and difficult situations is very useful in many areas. The Fishbone strategy is one of the most progressive. This graphical technique helps to identify possible causes of problems, to set the goals, and also show internal connections between the different parts of problem. After reviewing all causes and facts, you can easily find right solution.
ConceptDraw DIAGRAM diagramming and vector drawing software extended with Fishbone Diagrams Solution from the Management Area of ConceptDraw Solution Park is a powerful Fishbone Problem Solving tool.

Infographic Maker

Infographic is a visual way of representing various information, data, knowledge in statistics, geography, journalism, education, and much more areas. ConceptDraw DIAGRAM supplied with Pictorial Infographics Solution from the “Infographics” Area, provides a set of powerful pictorial infographics tools. Thanks to them it is the best Infographic Maker.

Pyramid Diagram

At the base of the identity of an organisational is its organizational culture.

Illustration Software

No science can't exist without illustrations, and especially astronomy! Illustrations help to visualize knowledge, natural phenomenons which are studied by astronomy, they equally effective help in work, during the learning process and on the conferences.
Now we have professional astronomy illustration software - ConceptDraw DIAGRAM illustration and sketching software with templates, samples and libraries of a variety of astronomy symbols, including constellations, galaxies, stars, and planet vector shapes; a whole host of celestial bodies. When drawing scientific and educational astronomy illustrations, astronomy pictures and diagrams, can help you reach for the stars!

Human Resource Development

Human Resource Development (HRD) focuses on the help employees develop their personal and organizational skills, abilities, and knowledge, HRD also helps to adapt an organization to the changing of external environment.
ConceptDraw DIAGRAM diagramming and vector drawing software supplied with HR Flowcharts Solution from the Management Area of ConceptDraw Solution Park can effectively help in labour-intensive process of human resource development.