Pyramid Diagram

Pyramid Diagram

Pyramid Diagram

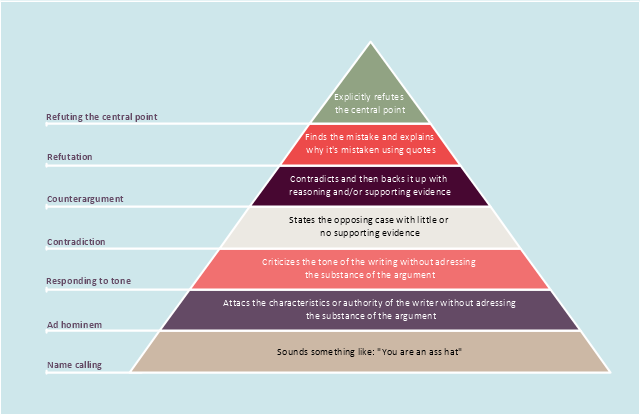
"Graham proposed a "disagreement hierarchy" in a 2008 essay "How to Disagree", putting types of argument into a seven-point hierarchy and observing that "If moving up the disagreement hierarchy makes people less mean, that will make most of them happier."
Although originally written as a simple list, Graham's hierarchy can be represented as a pyramid with the most convincing form of disagreement at the top, and the weakest at the bottom.
Graham notes that articulate forms of name-calling ("The author is a self-important dilettante.") are no different from crude insults, in this hierarchy." [Paul Graham (computer programmer). Wikipedia]
The pyramid diagram example "Graham's hierarchy of disagreement" was redesigned using the ConceptDraw PRO diagramming and vector drawing software from Wikimedia Commons file Graham's Hierarchy of Disagreement.svg. [commons.wikimedia.org/ wiki/ File:Graham's Hierarchy of Disagreement.svg]
The triangle chart example "Graham's hierarchy of disagreement" is included in the Pyramid Diagrams solution from the Marketing area of ConceptDraw Solution Park.
Pyramid diagram
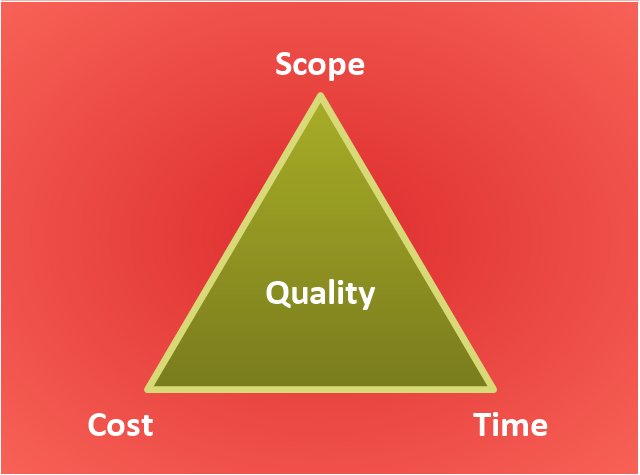
"The Project Management Triangle (called also Triple Constraint or the Iron Triangle) is a model of the constraints of project management. It is a graphic aid where the three attributes show on the corners of the triangle to show opposition. It is useful to help with intentionally choosing project biases, or analyzing the goals of a project. It is used to illustrate that project management success is measured by the project team's ability to manage the project, so that the expected results are produced while managing time and cost." [Project management triangle. Wikipedia]
The pyramid chart example "Project management triangle diagram" was redesigned using the ConceptDraw PRO diagramming and vector drawing software from Wikimedia Commons file Project-triangle-en.svg. [commons.wikimedia.org/ wiki/ File:Project-triangle-en.svg]
The project management triangle chart example is included in the Pyramid Diagrams solution from the Marketing area of ConceptDraw Solution Park.
Pyramid diagram
Pyramid Chart Maker

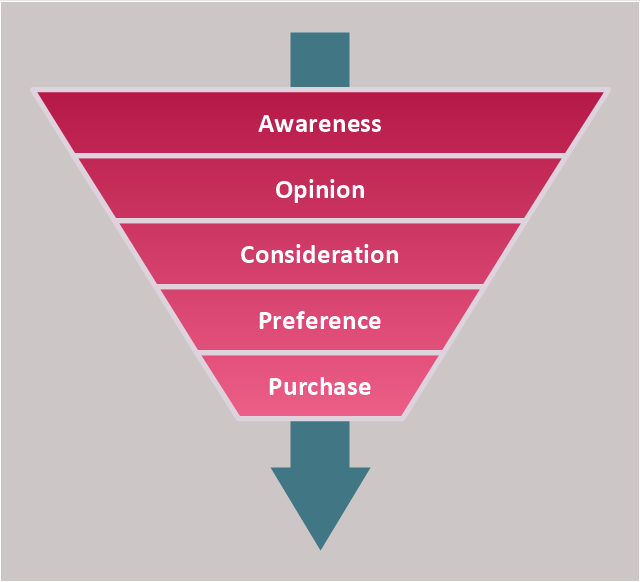
"The purchase or purchasing funnel is a consumer focused marketing model which illustrates the theoretical customer journey towards the purchase of a product or service. The Purchase Funnel is also often referred to as the “customer funnel,” “marketing funnel,” or “sales funnel”." [Purchase funnel. Wikipedia]
The purchase funnel diagram example was redesigned using the ConceptDraw PRO diagramming and vector drawing software from Wikimedia Commons file Purchase-funnel-diagram.svg. [commons.wikimedia.org/ wiki/ File:Purchase-funnel-diagram.svg]
This file is licensed under the Creative Commons Attribution 3.0 Unported license. [creativecommons.org/ licenses/ by/ 3.0/ deed.en]
The purchasing funnel chart sample is included in the Pyramid Diagrams solution from the Marketing area of ConceptDraw Solution Park.
Funnel diagram
Business Process Flowchart Symbols

 Website Wireframe
The innovative Website Wireframe solution enhances the ConceptDraw DIAGRAM functionality with newest wireframe tools, libraries with variety of predesigned icons, symbols, buttons, graphics, forms, boxes, and many other vector elements, templates and professionally designed samples, which make it the best wireframing software. Website Wireframe solution gives you significant advantages when designing and maintaining websites, creating skeletal and content-free depictions of website structure, making website prototypes and planning the content arrangement before committing to design, also speeds up the processes of sketching, producing and sharing wireframe examples of website style and interface design.
Simple & Fast Diagram Software


- DroidDia prime | Lead to opportunity sales flow | Pyramid Diagram ...
- Total Quality Management with ConceptDraw | Svg Gantt Chart
- Football pitch metric | Pyramid Diagram | Football fields - Vector ...
- Pyramid Diagram | Lead to opportunity sales flow | Process Flow ...
- Graham's hierarchy of disagreement - Pyramid diagram | Pyramid ...
- Pyramid Diagram | Workflow Diagram Software Mac | Customer ...
- Landscape Blueprint Svg
- Pyramid Diagram | Software Work Flow Process in Project ...
- Purchase funnel diagram | Pyramid Diagrams | Purchasing Funnel