Material Requisition Flowchart. Flowchart Examples

This hexagon diagram sample was redesigned from the Wikipedia file: Vicious circle in macroeconomics.svg. "An example of the use of a vicious circle in macroeconomics." [en.wikipedia.org/ wiki/ File:Vicious_ circle_ in_ macroeconomics.svg]
"A virtuous circle and a vicious circle (also referred to as virtuous cycle and vicious cycle) are economic terms. They refer to a complex chain of events that reinforces itself through a feedback loop. A virtuous circle has favorable results, while a vicious circle has detrimental results.
Both circles are complexes of events with no tendency towards equilibrium (at least in the short run). Both systems of events have feedback loops in which each iteration of the cycle reinforces the previous one (positive feedback). These cycles will continue in the direction of their momentum until an external factor intervenes and breaks the cycle. The prefix "hyper-" is sometimes used to describe these cycles if they are extreme. The best-known example of a vicious circle is hyperinflation. ...
Example in macroeconomics.
Vicious circle.
Hyperinflation is a spiral of inflation which causes even higher inflation. The initial exogenous event might be a sudden large increase in international interest rates or a massive increase in government debt due to excessive spendings. Whatever the cause, the government could pay down some of its debt by printing more money (called monetizing the debt). This increase in the money supply could increase the level of inflation. In an inflationary environment, people tend to spend their money quickly because they expect its value to decrease further in the future. They convert their financial assets into physical assets while their money still has some purchasing power. Often they will purchase on credit. Eventually, the currency loses all of its value. Because of this, the level of savings in the country is very low and the government could have problems refinancing its debt. Its solution could be to print still more money starting another iteration of the vicious cycle." [Virtuous circle and vicious circle. Wikipedia]
The crystal diagram example "Vicious circle" was created using the ConceptDraw PRO diagramming and vector drawing software extended with the Target and Circular Diagrams solution from the Marketing area of ConceptDraw Solution Park.
www.conceptdraw.com/ solution-park/ marketing-target-and-circular-diagrams
Hexagon diagram

Venn Diagram Examples for Problem Solving. Computer Science. Chomsky Hierarchy

Pyramid Chart Examples

Account Flowchart. Flowchart Examples

Sales Process Flowchart. Flowchart Examples

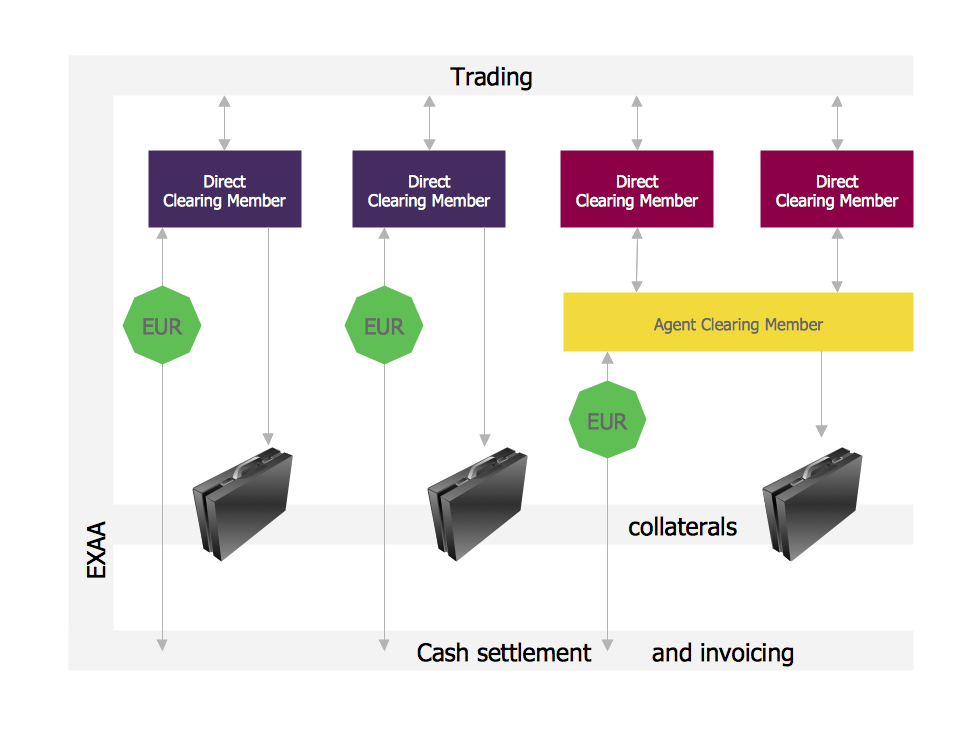
Settlement Process Flowchart. Flowchart Examples
Circular Arrow
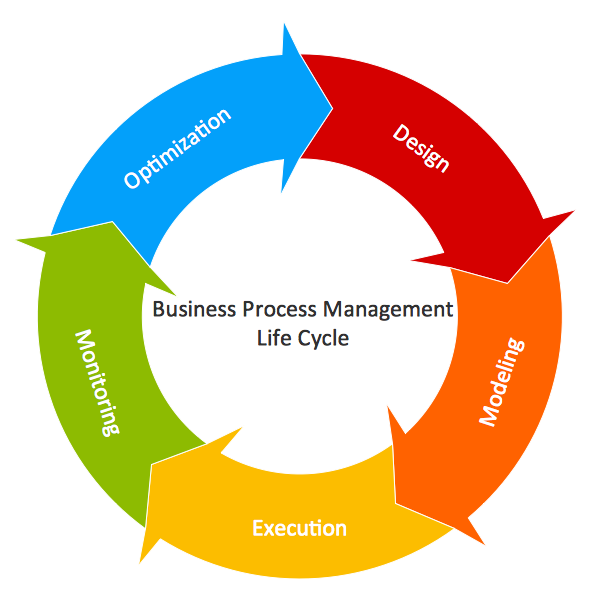
UML Business Process

- Diagram Of Purchasing Circle
- Explain The Purchasing Circle
- Vicious circle - Crystal diagram | Purchasing Circle Drawing
- Draw Purchase Cycle
- Draw And Label Any Purchasing Cycle Model
- Purchasing Circle Diagram
- Purchase order processing UML activity diagram | UML class ...
- Diagram Of A Purchasing Circle
- What Are The Diagrams For Documentation Purchase