Draw Flowcharts with ConceptDraw

Use the Best FlowChart Tool for the Job

"A Guide to the Project Management Body of Knowledge - Fifth Edition provides guidelines for managing individual projects and defines project management related concepts. It also describes the project management life cycle and its related processes, as well as the project life cycle.
The Guide recognizes 47 processes that fall into five basic process groups and ten knowledge areas that are typical of almost all projects.
The five process groups are:
Initiating,
Planning,
Executing,
Monitoring and Controlling,
Closing.
The ten knowledge areas are:
Project Integration Management,
Project Scope Management,
Project Time Management,
Project Cost Management,
Project Quality Management,
Project Human Resource Management,
Project Communications Management,
Project Risk Management,
Project Procurement Management,
Project Stakeholders Management (added in 5th edition).
Each of the ten knowledge areas contains the processes that need to be accomplished within its discipline in order to achieve an effective project management program. Each of these processes also falls into one of the five basic process groups, creating a matrix structure such that every process can be related to one knowledge area and one process group." [A Guide to the Project Management Body of Knowledge. Wikipedia]
The flow chart example "Project management life cycle" was created using the ConceptDraw PRO diagramming and vector drawing software extended with the Flowcharts solution from the area "What is a Diagram" of ConceptDraw Solution Park.
Flowchart - Project management life cycle

Create Process Flowcharts

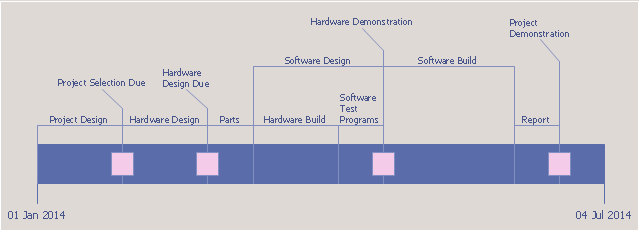
Timeline charts presents events and time periods on a chronological scale. They are used in project management to visualize project milestones and upper level phases, and show project progress.
"... timeline is used for project management. In these cases, timelines are used to help team members to know what milestones need to be achieved and under what time schedule. For example, in the case of establishing a project timeline in the implementation phase of the life cycle of a computer system." [Timeline. Wikipedia]
This project timeline diagram example was created using the ConceptDraw PRO diagramming and vector drawing software extended with the Timeline Diagrams solution from the Management area of ConceptDraw Solution Park.
Project timeline
"Product life cycle is a business analysis that attempts to identify a set of common stages in the life of commercial products. In other words the 'Product Life cycle' PLC is used to map the lifespan of the product such as the stages through which a product goes during its lifespan. ...
The stages of a product's life cycle... :
1. INTRODUCTION... 2. GROWTH... 3. MATURITY... 4. DECLINE...
The product life cycle is an important concept in marketing. It includes four stages that a product goes through from when it was first thought of until it is eliminated from the industry. Not all products reach this final stage. Some continue to grow and others rise and fall." [Product lifecycle. Wikipedia]
The flow chart example "Product life cycle process" was created using the ConceptDraw PRO diagramming and vector drawing software extended with the Flowcharts solution from the area "What is a Diagram" of ConceptDraw Solution Park.
Flowchart - Product life cycle process

UML Class Diagram Generalization Example UML Diagrams

Hybrid Network Topology

"Task management is the process of managing tasks through its life cycle. It involves planning, testing, tracking and reporting. Task management can help either individuals achieve goals, or groups of individuals collaborate and share knowledge for the accomplishment of collective goals. Tasks are also differentiated by complexity, from low to high.
Effective task management requires managing all aspects of a task, including its status, priority, time, human and financial resources assignments, recurrency, notifications and so on. These can be lumped together broadly into the basic activities of task management. ...
Task management may form part of project management and process management and can serve as the foundation for efficient workflow in an organisation. Project managers adhering to task-oriented management have a detailed and up-to-date project schedule, and are usually good at directing team members and moving the project forward. ...
Task life cycle.
The status of tasks can be described by the following states:
Ready,
Assigned,
Terminated,
Expired,
Forwarded,
Finished,
Failed." [Task management. Wikipedia]
The example "Project management task status dashboard" was created using the ConceptDraw PRO diagramming and vector drawing software extended with the Status Dashboard solution from the area "What is a Dashboard" of ConceptDraw Solution Park.
Status dashboard

The vector stencils library "Timelines and milestones" contains 24 shapes of time scales with start and finish dates, time interval bars with progress indication and brackets, milestone, event and today markers for drawing the timeline diagrams using the ConceptDraw PRO diagramming and vector drawing software.
"A timeline is a way of displaying a list of events in chronological order, sometimes described as a project artifact. It is typically a graphic design showing a long bar labelled with dates alongside itself and (usually) events labelled on points where they would have happened. ...
Another type of timeline is used for project management. In these cases, timelines are used to help team members to know what milestones need to be achieved and under what time schedule. For example, in the case of establishing a project timeline in the implementation phase of the life cycle of a computer system." [Timeline. Wikipedia]
The example "Design elements - Timelines solution" is included in the Timeline Diagrams solution from the Management area of ConceptDraw Solution Park.
Timeline and milestone symbols

- Product life cycle graph | Accounting Cycle Example | Water cycle ...
- Project management life cycle - Flowchart | Pmlc Wikipedia
- Project management life cycle - Flowchart | Product life cycle ...
- Product life cycle process - Flowchart | Project management life ...
- BPM life cycle | Product life cycle process - Flowchart | Life cycle ...
- Product life cycle graph | Push Notification Lifecycle Overview ...
- CMP adaptive management cycle | Project management life cycle ...
- Wikipedia Flowchart
- Product life cycle graph | Draw Flowcharts with ConceptDraw ...
- EPC diagrams - Vector stencils library | Project management life ...