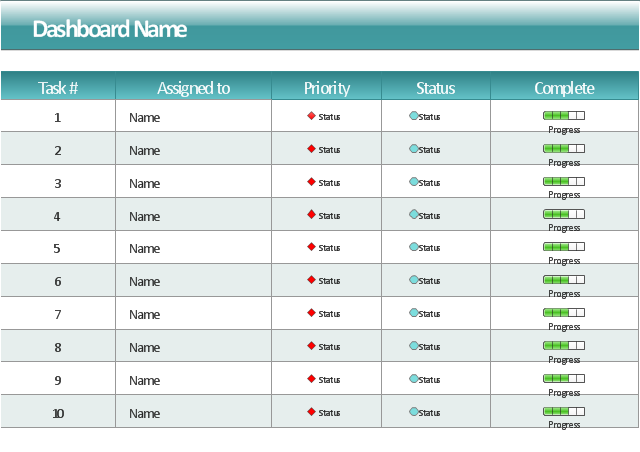
This project task status dashboard template display the task table consisting of the columns for task number, assignment (responsible person name), priority, status and complete. The task priority and status are indicated with alert visual indicators. The task complete is showed by progress indicators.
The template "Project task status dashboard" for the ConceptDraw PRO diagramming and vector drawing software is included in the Status Dashboard solution from the area "What is a Dashboard" of ConceptDraw Solution Park.
The template "Project task status dashboard" for the ConceptDraw PRO diagramming and vector drawing software is included in the Status Dashboard solution from the area "What is a Dashboard" of ConceptDraw Solution Park.
Project task status dashboard template
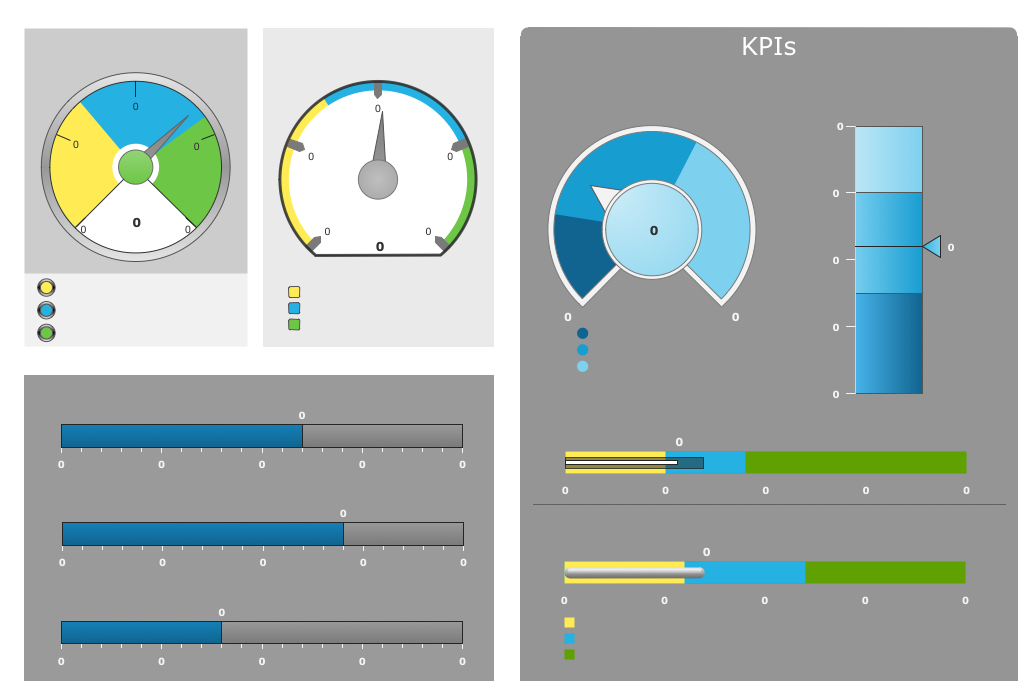
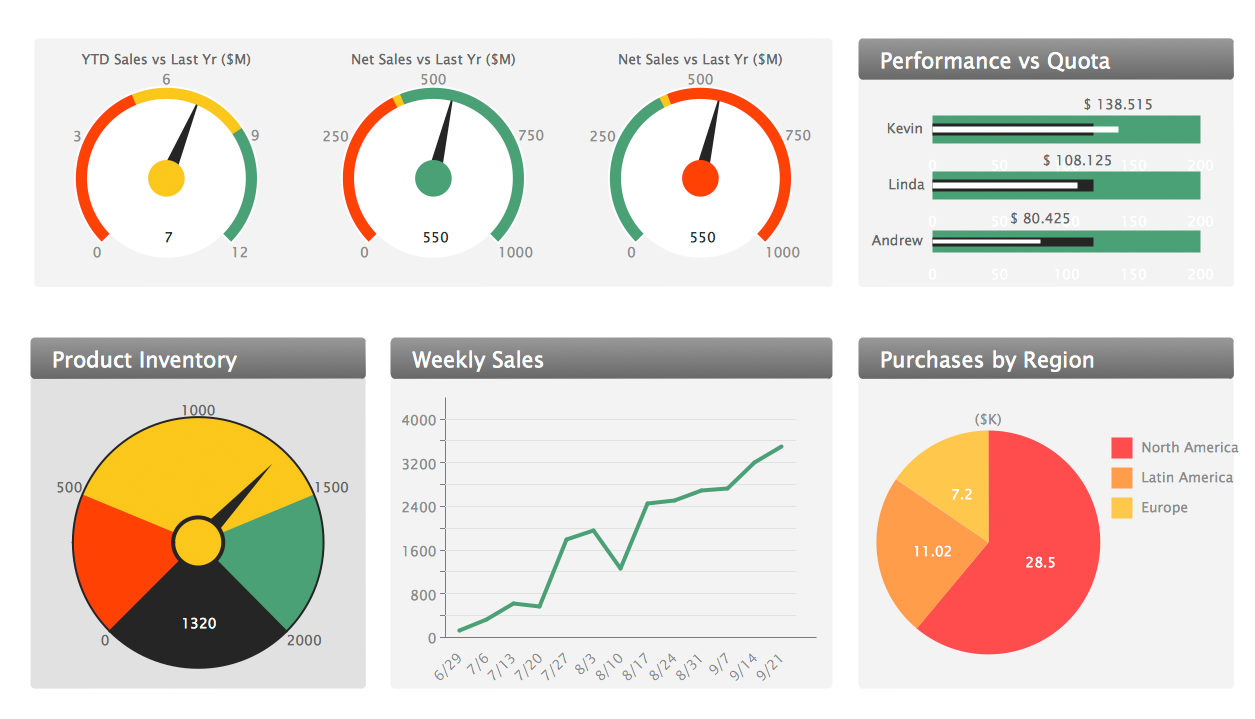
 Status Dashboard
Status dashboard solution extends ConceptDraw DIAGRAM software with templates, samples and vector stencils libraries with graphic indicators for drawing the visual dashboards showing status data.
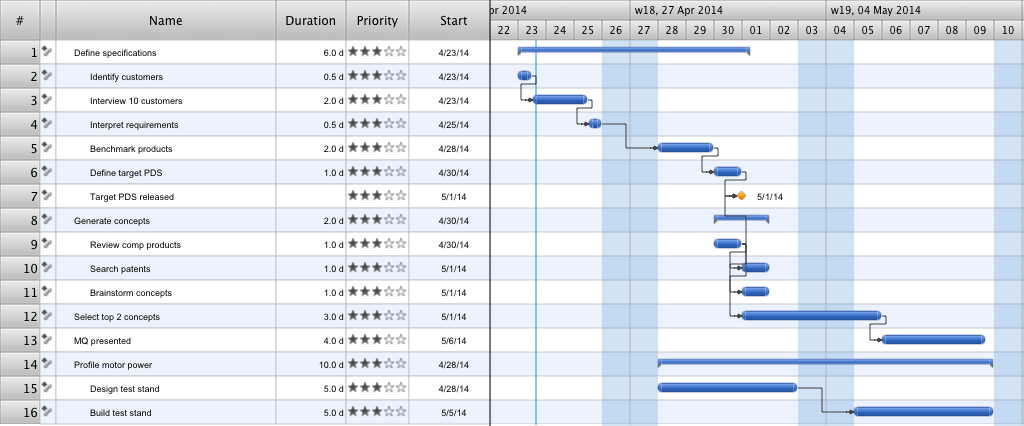
Gantt Chart Templates
Customer Relationship Management

HelpDesk
How to Track Your Project Plan vs. the Actual Project Condition

Sales Dashboard - insight about potential opportunities and key sales operations

Empower Your Sales Team With a Sales Dashboard
 Logistic Dashboard
The powerful tools of Logistic Dashboard solution and specially developed live graphic objects of logistic icons, logistic navigation elements, logistic indicators, logistic charts and logistic maps effectively assist in designing Logistic dashboards, Logistic maps, Logistic charts, diagrams and infographics. The included set of prebuilt samples and quick-start templates, demonstrates the power of ConceptDraw DIAGRAM software in logistics management, its assisting abilities in development, realization and analyzing the logistic processes, as well as in perfection the methods of logistics management.
Sales Dashboard Screenshot
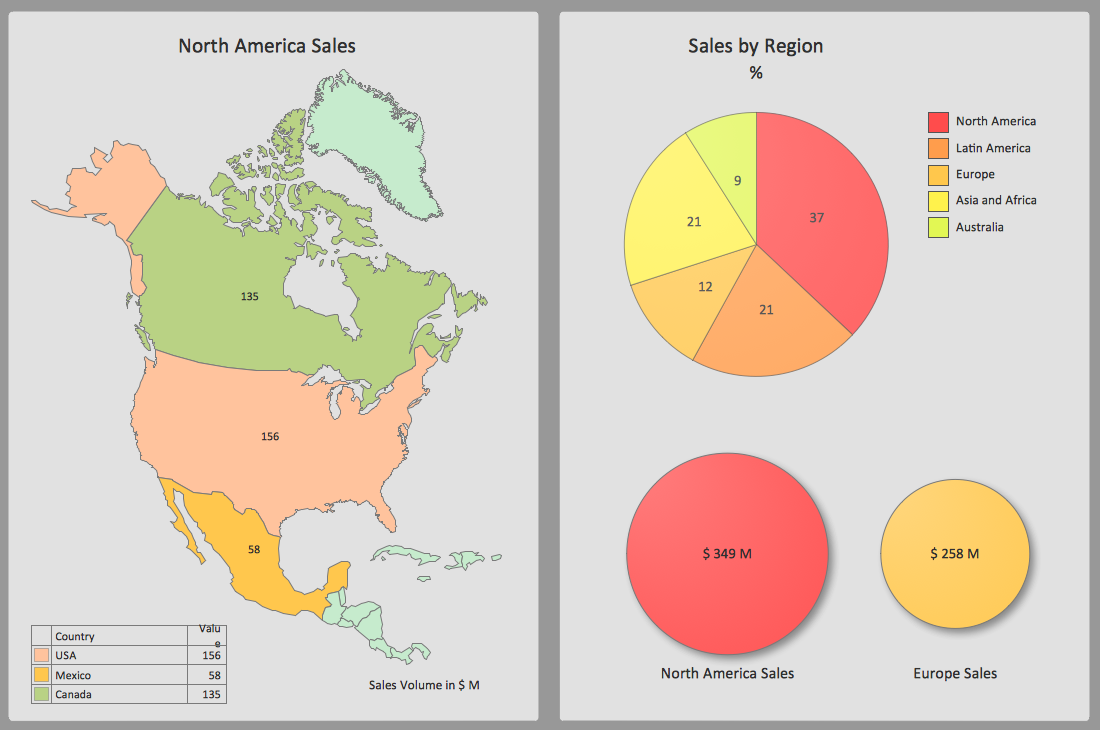
Sales Dashboard
- Multiple Project Dashboard Template Excel
- Construction Project Management Dashboard Template
- Project task status dashboard - Template | Status Dashboard | PM ...
- Project management task status dashboard | Project task status ...
- Project task status dashboard - Template | Status Dashboard ...
- Progress Dashboard Examples
- Status Dashboard | Project task status dashboard - Template | PM ...
- Project task status dashboard - Template | | How To Create Project ...
- Project task status dashboard - Template | Sales Dashboard ...
- Status Dashboard | Projects HR dashboard | A KPI Dashboard ...