This site uses cookies. By continuing to browse the ConceptDraw site you are agreeing to our Use of Site Cookies.

Building Drawing Software for Design Seating Plan

A seating plan is a scheme showing a set of seats of some place. Seats can be grouped in rows like in stadiums, or be separate. Seats can be numerated, which allows spectators to choose them beforehand, which is useful for cinemas or theatres. Customers choose places considering their proper price range and have a guaranteed seat. In addition, there is no point to arrive at the event early.

Process Flowchart

ConceptDraw is Professional business process mapping software for making process flow diagram, workflow diagram, general flowcharts and technical illustrations for business documents. It is includes rich examples, templates, process flowchart symbols. ConceptDraw flowchart maker allows you to easier create a process flowchart. Use a variety of drawing tools, smart connectors, flowchart symbols and shape libraries to create flowcharts of complex processes, process flow diagrams, procedures and information exchange.
How To Create a Process Flow Chart (business process modelling techniques)

Microreports, calendars, project management, project, project to-do lists, project checklists, solution park PM Personal Time Management

Microreports, calendars, project management, project, project to-do lists, project checklists, solution park
PM Personal Time Management solution extends the ConceptDraw Solution Park and all ConceptDraw Office suite products providing every project participant with tools and features allowing tracking timeframe, workspace and role in a project with the aid of Microreports, calendars, and project To-Do lists. PM Personal Time Management solution makes the collaborative work easier and improves personal performance, now each project participant stays informed about the task lists, calendars and future tasks for itself and its colleagues. Be effective in project management and personal time management, generate easily your personal To-Do lists, personal calendars, personal assignment lists, project checklists, and communicate with your colleagues using e-mail and sending project Microreports via e-mail with one click.

Project management - Design Elements

These vector illustrations and cliparts are created for drawing the Project management Illustrations and contain plenty of project management design elements. The clipart library Project management includes 35 icons.

SWOT Analysis

The SWOT Analysis provides information that is helpful in matching the firm's resources and capabilities to the competitive environment in which it operates. As such, it is instrument in strategy formulation and selection. SWOT analysis is a method of strategic planning which identifies the factors internal and external environment of the firm and divides them into 4 categories: strengths, weaknesses, opportunities and threats. The ConceptDraw PRO and MINDMAP software allow professional to make well-designed SWOT matrix in minutes.
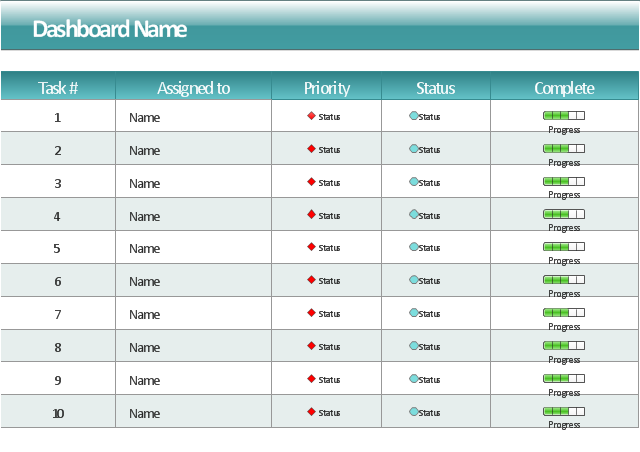
This project task status dashboard template display the task table consisting of the columns for task number, assignment (responsible person name), priority, status and complete. The task priority and status are indicated with alert visual indicators. The task complete is showed by progress indicators.
The template "Project task status dashboard" for the ConceptDraw PRO diagramming and vector drawing software is included in the Status Dashboard solution from the area "What is a Dashboard" of ConceptDraw Solution Park.
Project task status dashboard template
Project task status dashboard template, shapes alert indicator, progress indicator, progress bar, 5-state alert,

Entity Relationship Diagram Examples

Creating an entity-relationship (ER) model is to visually represent the structure of a business database, where data equates to entities (or objects) that are linked by defined relationships expressing dependencies and requirements. By nature it is an abstract visualization, the first step in the design process towards creating a logical and functional database.
ConceptDraw gives the ability to describe a database using the Entity-Relationship model. Entity-Relationship Diagram solution includes icons advocated by Chen's and Crow’s Foot notation that can be used when describing a database.
How to Build an Entity Relationship Diagram (ERD)

Currency - Design Elements

Take a look which samples and templates of currency (paper money and coins symbols and illustrations) we have prepared for you.

Program libraries contain vector cliparts elements for drawing the Currency Illustrations and plenty pictures with Money thematics.

Flowchart Components

The ConceptDraw Flowchart component includes a set of samples and templates. This geathered as flowchart maker toolbox which focused on drawing flowcharts of any industry standards.