Gane Sarson Diagram

Structured Systems Analysis and Design Method. SSADM with ConceptDraw DIAGRAM

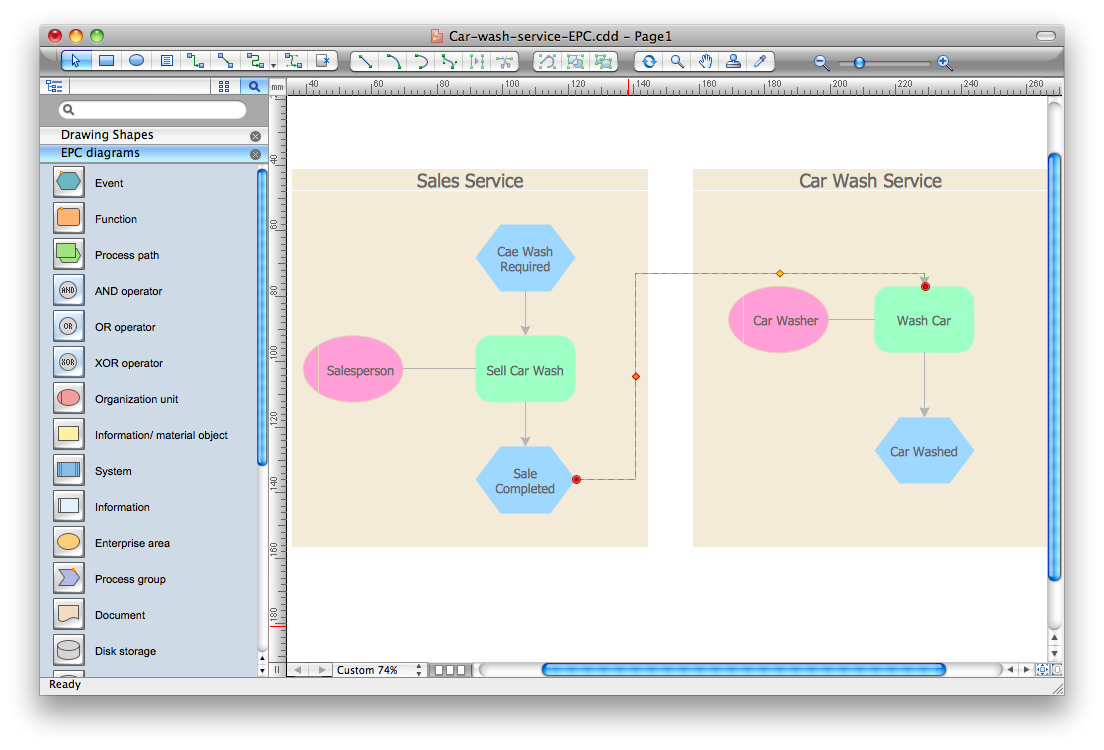
Event-Driven Process Chain Diagram Software
Value Stream & Process Flow Diagramming Software

Value Stream Mapping Icons
CORRECTIVE ACTIONS PLANNING. PERT Chart


 Calendars
Calendars solution extends ConceptDraw DIAGRAM software with templates, samples and library of vector stencils for drawing the business calendars and schedules.
 PM Agile
PM Agile solution provides powerful tools for project management, project planning and software development, ensuring support of Agile methods, assisting in holding the Scrum-meetings, collaborative planning sprints, maintaining backlog, calculating and reporting the velocity of the team. Intended for the companies using Agile methodology, specifically Scrum, Product Owners, Scrum Masters, software developers, and management specialists, this solution includes examples demonstrating the main principles of Agile methodology and Scrum, and numerous templates specially developed in ConceptDraw DIAGRAM and ConceptDraw MINDMAP applications. All Agile meetings and documents are powered by the mission of adapted Mind Map templates, tuned for collaborative work of development team. The key diagrams for visualization are made in ConceptDraw DIAGRAM.
IDEF1X Standard

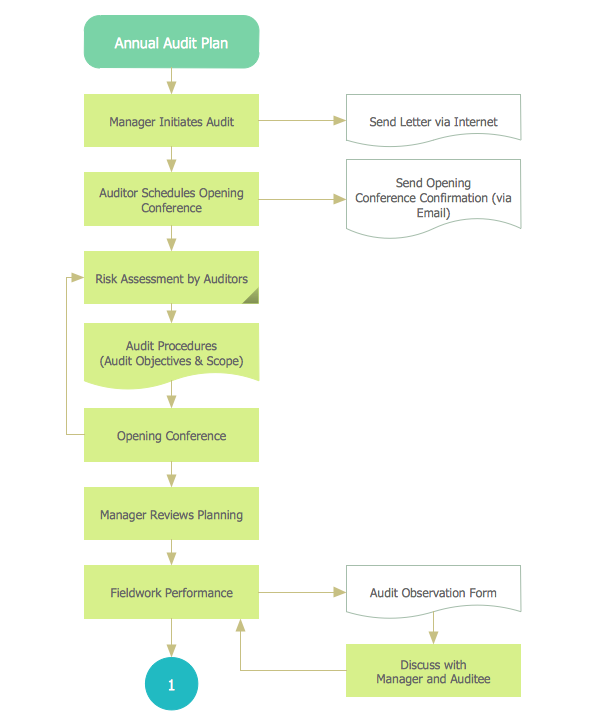
Chart Audit
- Data Flow Diagram For Appointment Schedule
- Data Flow Diagram For Online Appointment Booking
- Appointment Process Through Flow Chart
- Types of Flowchart - Overview | DFD Library System | Types of ...
- Cubetto Flowchart | Hiring process workflow | E-Filing general ...
- Gane Sarson Diagram | DFD, Gane-Sarson notation - Template ...
- How to Change the Working Time in a Project | Business Calendar ...
- Calendars | Business calendar example | How to Draw a Gantt Chart ...
- Design elements - HR charts | HR Flowcharts | How to Create a HR ...
- Business calendar example | Business Calendar | How to Create ...