This site uses cookies. By continuing to browse the ConceptDraw site you are agreeing to our Use of Site Cookies.

Business diagrams & Org Charts with ConceptDraw DIAGRAM

Business flowcharting tool helps you create a flowchart with minimal effort. With ConceptDraw you can make a flowchart, draw data flow diagrams, orgchart professional, process flow diagrams etc - without any prior knowledge or training.
Draw Business Process Diagrams
HelpDesk

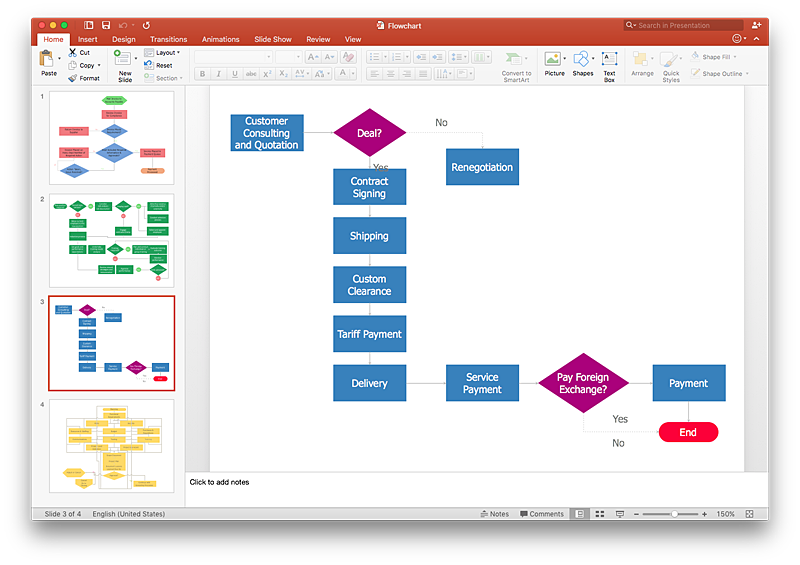
How To Make a PowerPoint Presentation of Flowcharts

ConceptDraw DIAGRAM allows you to create a professional flowchart quickly and easily. The ability to create flowcharts is contained in the Flowcharts solution. To submit flowcharts for the audience, you can use export to MS PowerPoint.
HelpDesk

How to Add a Rack Diagram to a PowerPoint Presentation

Rack diagrams are created to make short work of configuring and documenting the server and network equipment of the rack frameworks. Rack diagrams may be useful when considering equipment purchasing or installing. Using the ConceptDraw Rack Diagrams solution, you can quickly and easily design a rack diagram from the set of vector graphics objects that are fully consistent with accepted industry standards. The Rack diagram will help you when considering and purchasing a rack of network equipment. When installing equipment, a rack diagram will help you to situate equipment quickly and in a due manner.
The PowerPoint presentation on the concept of your server room rack layouts can be very informative and helpful. ConceptDraw DIAGRAM allows you to easily create wireless network diagrams and then make a PowerPoint Presentation from your diagrams in a single click.
HelpDesk

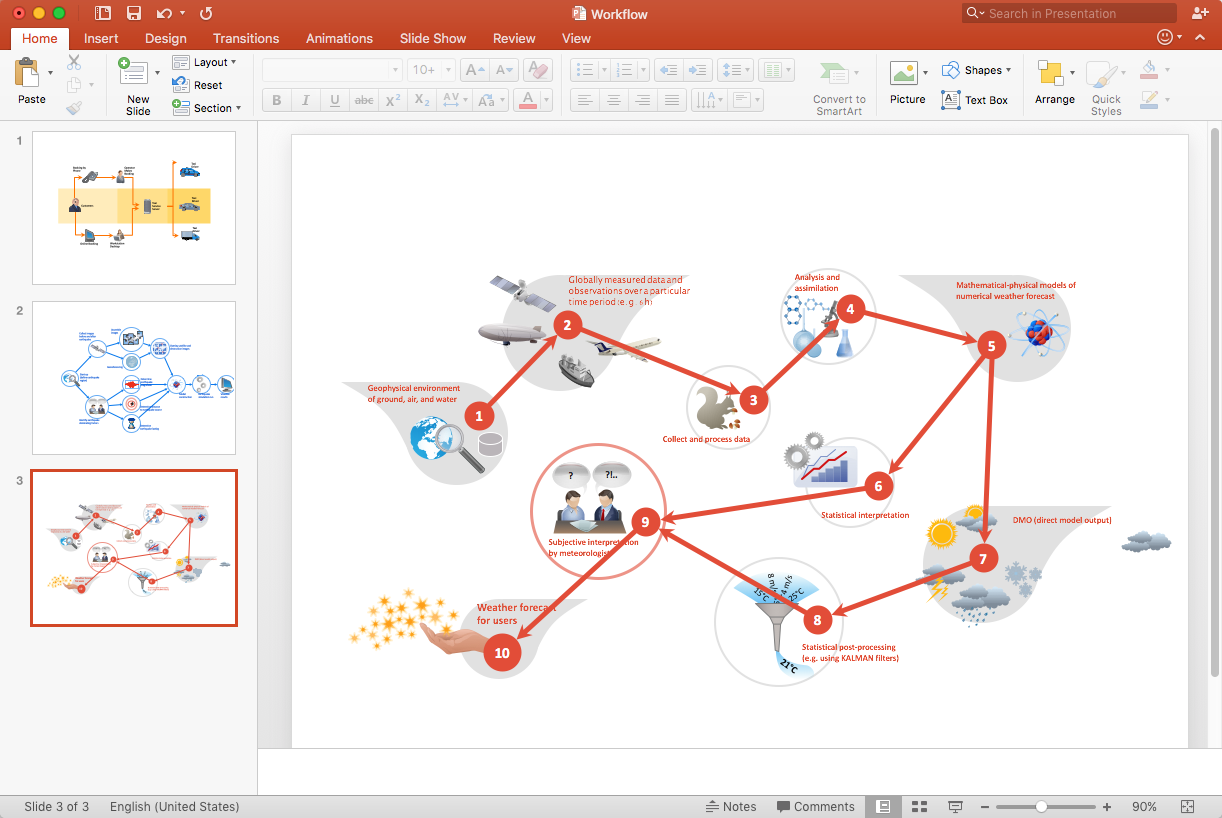
How to Add a Workflow Diagram to a PowerPoint Presentation

Making workflow diagrams in PowerPoint can help to describe the process within your organization as well as making comprehensive analysis presentations for sales or management and also can be used in other presentations and business documentation.
HelpDesk

How To Add a Computer Network Diagram to a PowerPoint Presentation

The PowerPoint presentation of the computer network can be very informative. ConceptDraw DIAGRAM allows you to easily create computer network diagrams and then make a PowerPoint Presentation from your network diagrams in a single click.
HelpDesk

How to Add a Bubble Diagram to PowerPoint Presentation

Bubble diagrams can be used to compare concepts and identify areas of similarity and difference. ConceptDraw DIAGRAM allows you to make an MS PowerPoint Presentation from your charts in a few simple steps. A bubble diagram is a chart that represents information visually in the form of a series of bubbles. Bubble charts are often used in marketing and management during the early stages of product development to visualize ideas and concepts by organizing them in a hierarchy. The ability to create this form of a diagram is contained within the Bubble Diagrams solution. A PowerPoint presentation of bubble diagrams can be used to demonstrate and identify areas of similarity and difference of featured business ideas and concepts.
HelpDesk

How to Make PowerPoint Presentation of Data Driven Infographics

ConceptDraw DIAGRAM can be used as a tool for creating data-driven infographics. It allows you to draw data driven using the special templates and vector stencils libraries. ConceptDraw DIAGRAM allows you to make an MS PowerPoint Presentation from your Data-driven infographics in a few simple steps.