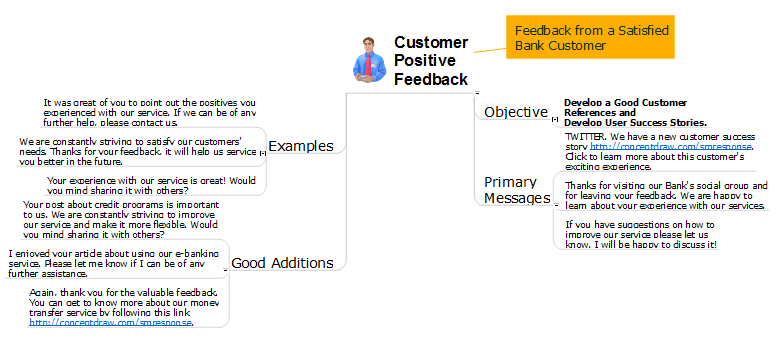
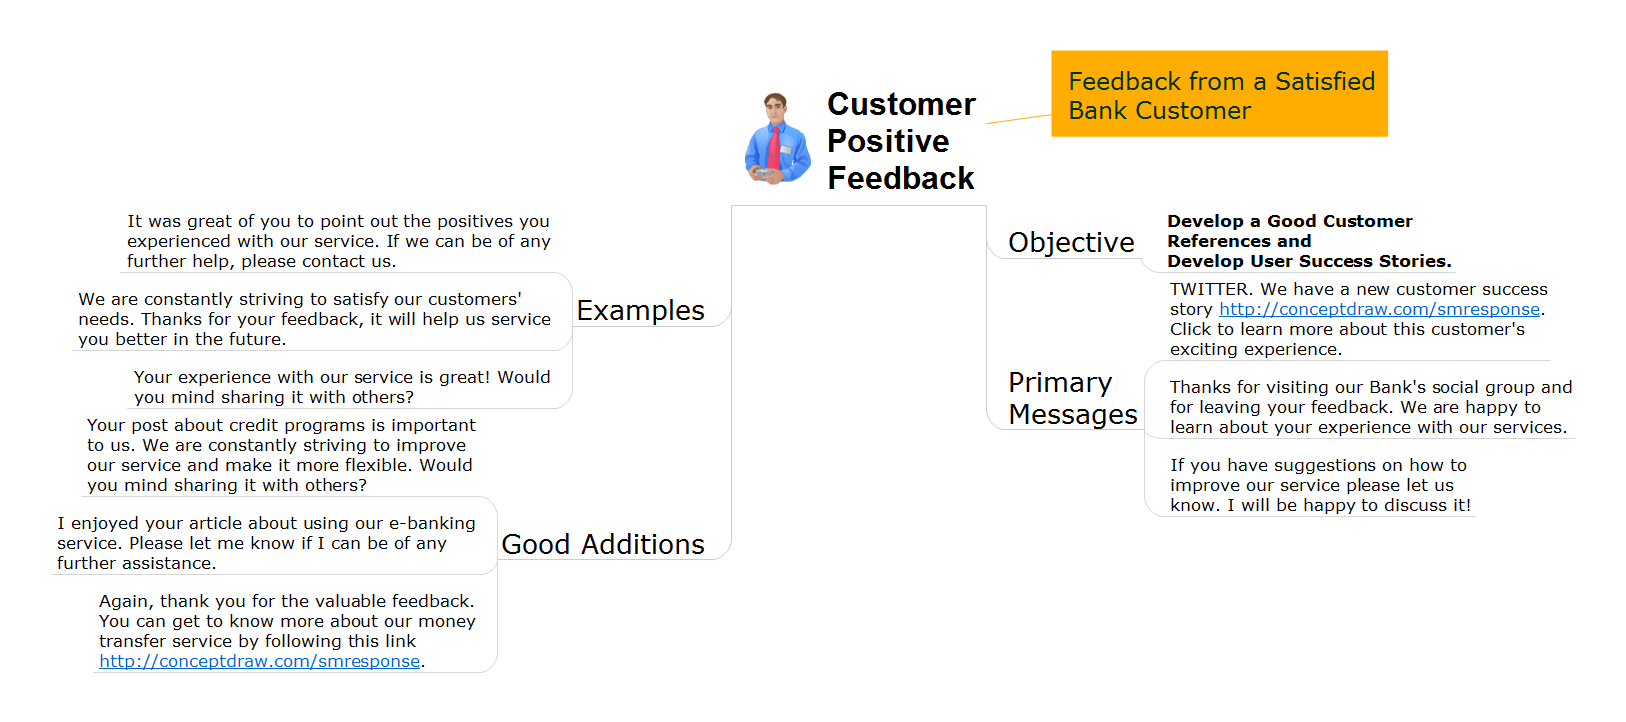
Bank Customer Positive Feedback
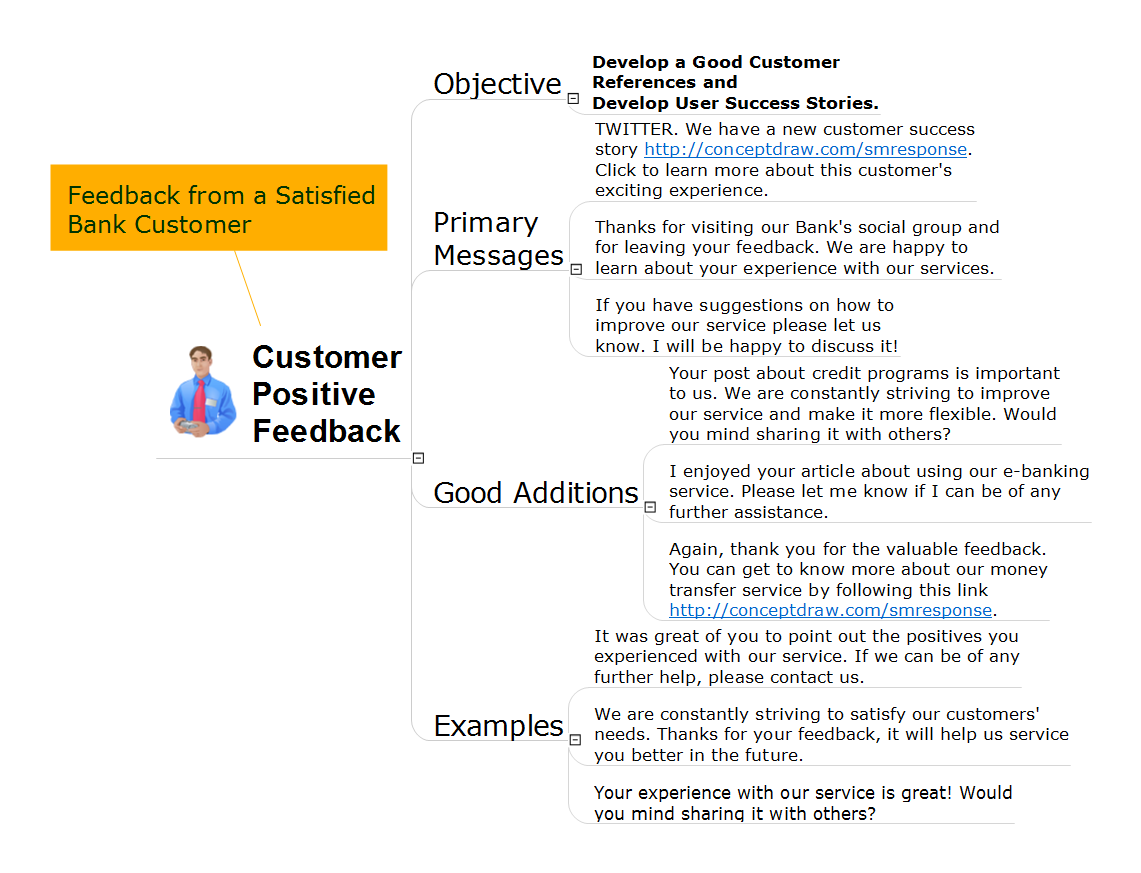
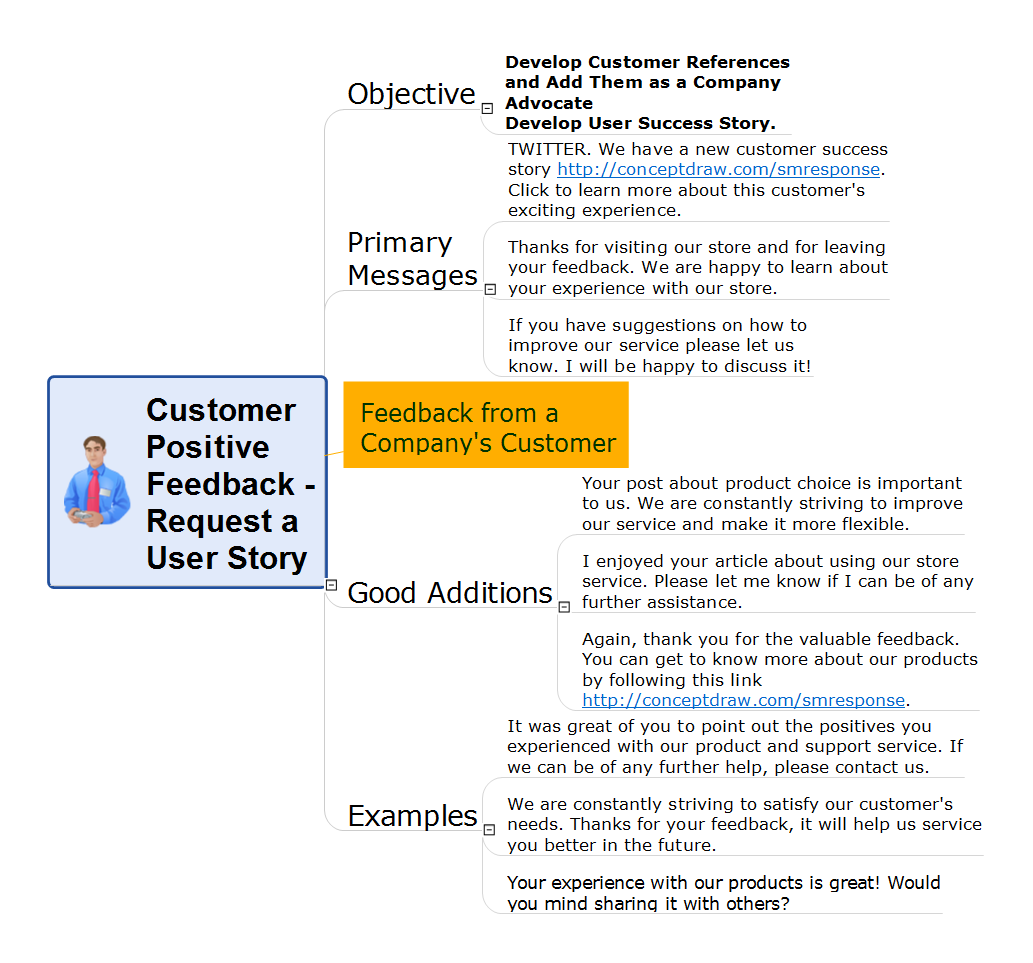
Positive Customer Feedback
 Social Media Response
This solution extends ConceptDraw DIAGRAM and ConceptDraw MINDMAP with the ability to draw interactive flow charts with action mind map templates, to help create an effective response to applicable social media mentions.
How to Prepare Learning Presentations for Training
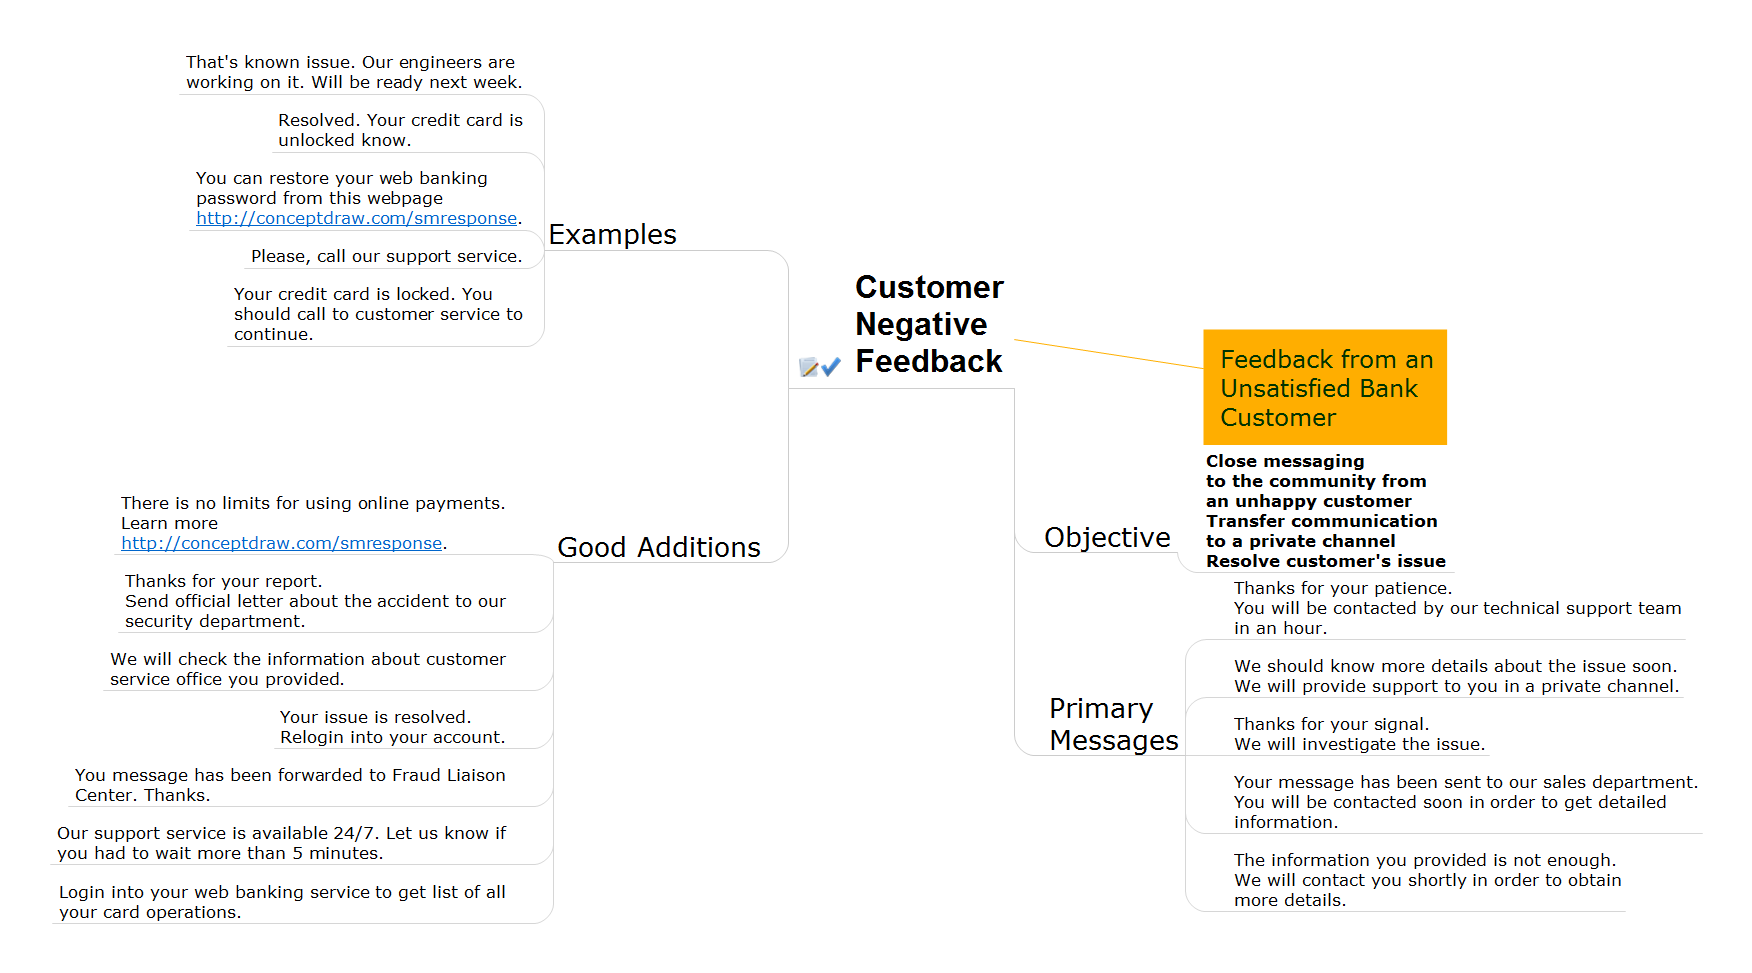
Response to Customer Negative Feedback

The Means to Respond to Social Media Mentions
That Helps Professional Social Media Teams
This hexagon diagram sample was redesigned from the Wikipedia file: Vicious circle in macroeconomics.svg. "An example of the use of a vicious circle in macroeconomics." [en.wikipedia.org/ wiki/ File:Vicious_ circle_ in_ macroeconomics.svg]
"A virtuous circle and a vicious circle (also referred to as virtuous cycle and vicious cycle) are economic terms. They refer to a complex chain of events that reinforces itself through a feedback loop. A virtuous circle has favorable results, while a vicious circle has detrimental results.
Both circles are complexes of events with no tendency towards equilibrium (at least in the short run). Both systems of events have feedback loops in which each iteration of the cycle reinforces the previous one (positive feedback). These cycles will continue in the direction of their momentum until an external factor intervenes and breaks the cycle. The prefix "hyper-" is sometimes used to describe these cycles if they are extreme. The best-known example of a vicious circle is hyperinflation. ...
Example in macroeconomics.
Vicious circle.
Hyperinflation is a spiral of inflation which causes even higher inflation. The initial exogenous event might be a sudden large increase in international interest rates or a massive increase in government debt due to excessive spendings. Whatever the cause, the government could pay down some of its debt by printing more money (called monetizing the debt). This increase in the money supply could increase the level of inflation. In an inflationary environment, people tend to spend their money quickly because they expect its value to decrease further in the future. They convert their financial assets into physical assets while their money still has some purchasing power. Often they will purchase on credit. Eventually, the currency loses all of its value. Because of this, the level of savings in the country is very low and the government could have problems refinancing its debt. Its solution could be to print still more money starting another iteration of the vicious cycle." [Virtuous circle and vicious circle. Wikipedia]
The crystal diagram example "Vicious circle" was created using the ConceptDraw PRO diagramming and vector drawing software extended with the Target and Circular Diagrams solution from the Marketing area of ConceptDraw Solution Park.
www.conceptdraw.com/ solution-park/ marketing-target-and-circular-diagrams
Hexagon diagram

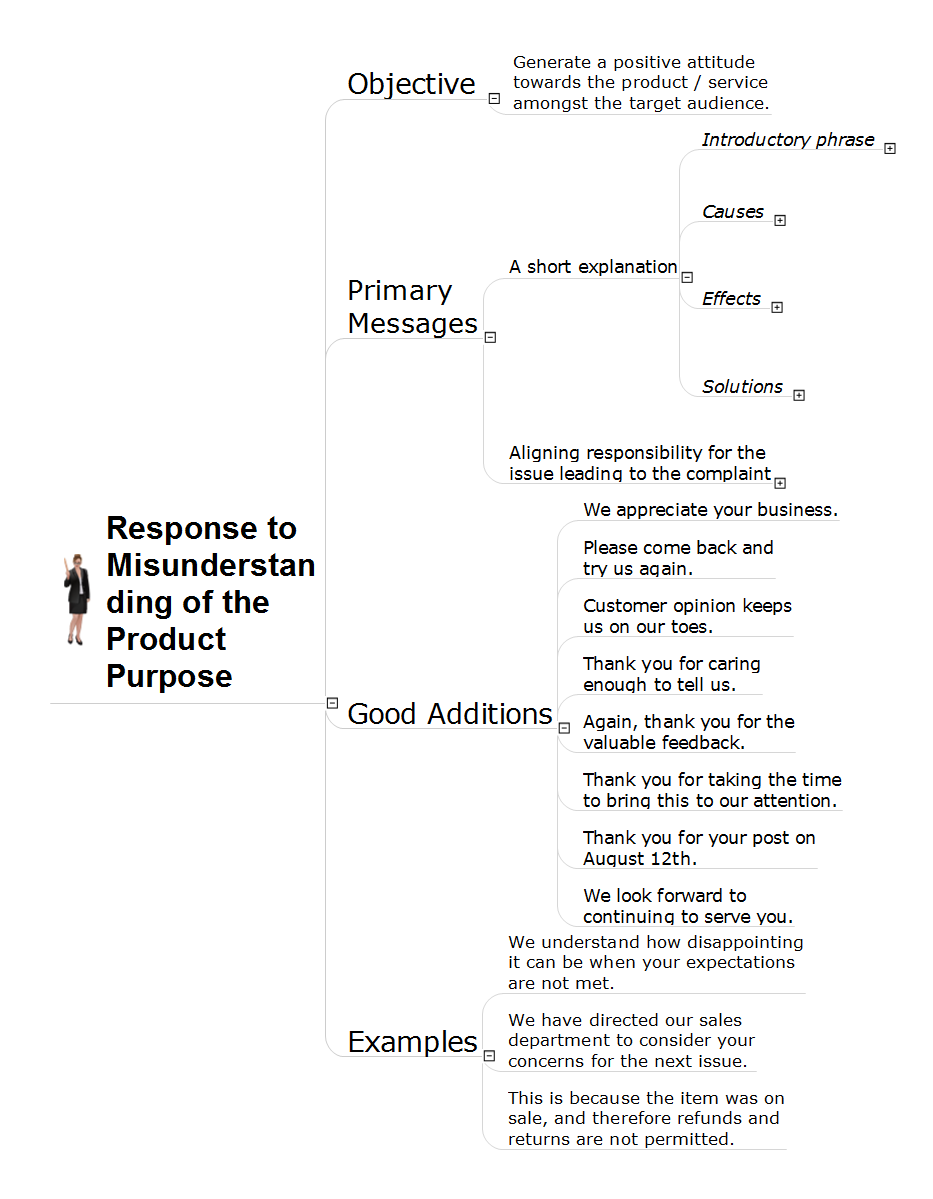
Misunderstanding Product Purpose
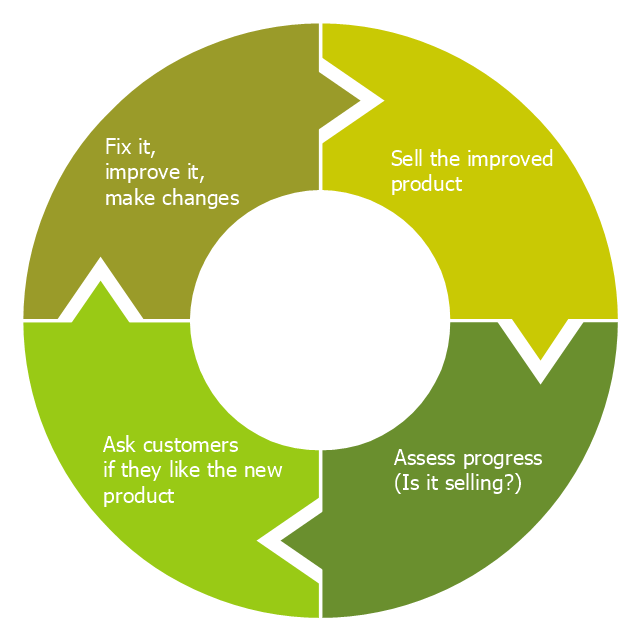
"Feedback is a process in which information about the past or the present influences the same phenomenon in the present or future. As part of a chain of cause-and-effect that forms a circuit or loop, the event is said to "feed back" into itself. ...
Feedback loop - the complete causal path that leads from the initial detection of the gap to the subsequent modification of the gap. ...
Feedback is commonly divided into two types - usually termed positive and negative. The terms can be applied in two contexts:
(1) the altering of the gap between reference and actual values of a parameter, based on whether the gap is widening (positive) or narrowing (negative),
(2) the valence of the action or effect that alters the gap, based on whether it has a happy (positive) or unhappy (negative) emotional connotation to the recipient or observer." [Feedback. Wikipedia]
This cycle diagram example was redesigned from the Wikimedia Commons file: Business Feedback Loop.jpg. [commons.wikimedia.org/ wiki/ File:Business_ Feedback_ Loop.jpg]
This file is made available under the Creative Commons CC0 1.0 Universal Public Domain Dedication. [creativecommons.org/ publicdomain/ zero/ 1.0/ deed.en]
The ring chart example "Business feedback loop" was created using the ConceptDraw PRO diagramming and vector drawing software extended with the Target and Circular Diagrams solution from the Marketing area of ConceptDraw Solution Park.
www.conceptdraw.com/ solution-park/ marketing-target-and-circular-diagrams
Ring chart
- Positive Feedback Samples
- Example Of Positive Feedback Of Product
- Social Media Response | Business feedback loop | Example Of ...
- Bank Customer Positive Feedback | Business feedback loop - Ring ...
- Bank Customer Positive Feedback | How to Realize your Social ...
- Bank Customer Positive Feedback | Bank Detailed Answers | Bank ...
- Positive Feedback Service Examples
- Positive Customer Feedback | Bank Customer Notifications | Bank ...
- Address to User Story Question | Bank Customer Positive Feedback ...
- Negative And Positive Feedback Venn Diagram