"Population growth' refers to the growth in human populations. Global population growth is around 80 million annually, or 1.2% p.a. The global population has grown from 1 billion in 1800 to 7 billion in 2012. It is expected to keep growing to reach 11 billion by the end of the century. Most of the growth occurs in the nations with the most poverty, showing the direct link between high population growth and low standards of living. The nations with high standards of living generally have low or zero rates of population growth. Australia's population growth is around 400,000 annually, or 1.8% p.a., which is nearly double the global average. It is caused mainly by very high immigration of around 200,000 p.a., the highest immigration rate in the world. Australia remains the only nation in the world with both high population growth and high standards of living." [Population growth. Wikipedia]
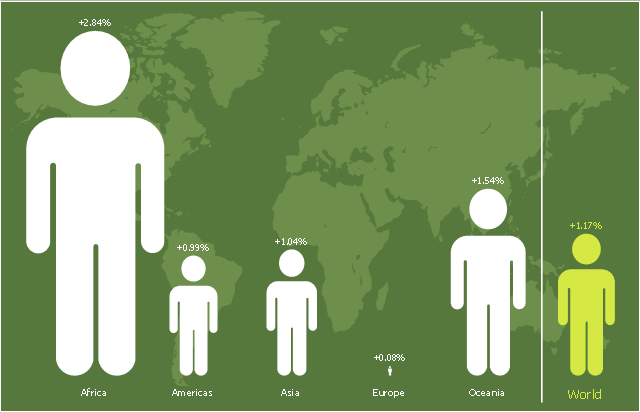
The pictorial chart example "Population growth by continent, 2010 - 2013" was created using the ConceptDraw PRO diagramming and vector drawing software extended with the Picture Graphs solution from the Graphs and Charts area of ConceptDraw Solution Park.
The pictorial chart example "Population growth by continent, 2010 - 2013" was created using the ConceptDraw PRO diagramming and vector drawing software extended with the Picture Graphs solution from the Graphs and Charts area of ConceptDraw Solution Park.
Image chart
Picture Graph

 Picture Graphs
Typically, a Picture Graph has very broad usage. They many times used successfully in marketing, management, and manufacturing. The Picture Graphs Solution extends the capabilities of ConceptDraw PRO v10 with templates, samples, and a library of professionally developed vector stencils for designing Picture Graphs.
Area Chart

Basic Diagramming


Step Area Graph

Geo Map - Asia

Use Geo Map Asia to draw thematic maps, geospatial infographics and vector illustrations for your business documents, presentations and websites.
Histogram

 Area Charts
Area Charts are used to display the cumulative totals over time using numbers or percentages; or to show trends over time among related attributes. The Area Chart is effective when comparing two or more quantities. Each series of data is typically represented with a different color, the use of color transparency in an object’s transparency shows overlapped areas and smaller areas hidden behind larger areas.
Growth-Share Matrix Software

The Matrices Solution also provides a wide variety of templates and samples that will help you to create the Matrix diagrams of any difficulty.
Geo Map - Europe - Belarus

Competitor Analysis

Scrum process work items and workflow

 Line Graphs
How to draw a Line Graph with ease? The Line Graphs solution extends the capabilities of ConceptDraw PRO v10 with professionally designed templates, samples, and a library of vector stencils for drawing perfect Line Graphs.
- Population Growth In A Pie Graph Images
- Image Graphs
- Picture Graphs | Pictures of Graphs | Area Charts | Population ...
- Pictures of Graphs | Population growth by continent, 2010 - 2013 ...
- Image chart - The total financing of the Philippines from 2001-2010 ...
- Basic Flowchart Images . Flowchart Examples | How to Connect an ...
- Picture Graph
- Pictures of Graphs | Population growth by continent, 2010 - 2013 ...
- Images Of Best Graph Of Population
- Picture Graphs | Population growth by continent, 2010 - 2013 ...
- Population Control Image Graph
- Picture Graphs | Population growth by continent, 2010 - 2013 ...
- Basic Diagramming | Sales Growth . Bar Graphs Example | Pictures ...
- Population growth by continent, 2010 - 2013 - Picture graph ...
- Line Graphs | Picture Graphs | People | Images Graphs On Growth ...
- Population growth by continent, 2010 - 2013 - Picture graph | Geo ...
- Bar Graph Of Population Growth Rate
- Growth Pictures To Draw
- San Francisco CA population growth | Population growth by ...
- Bar Graphs | Line Graphs | Sales Growth . Bar Graphs Example ...