 Spatial Infographics
Spatial infographics solution extends ConceptDraw PRO software with infographic samples, map templates and vector stencils libraries with design elements for drawing spatial information graphics.
Spatial infographics Design Elements: Location Map

How to draw Metro Map style infographics? Moscow, New York, Los Angeles, London

 What are Infographic Area
Solutions of the area What is Infographics from ConceptDraw Solution Park collect templates, samples and vector stencils libraries with design elements for the drawing information graphics.
 Fire and Emergency Plans
This solution extends ConceptDraw software with samples, templates and design elements for drawing the Fire and Emergency Plans.
Tools to Create Your Own Infographics

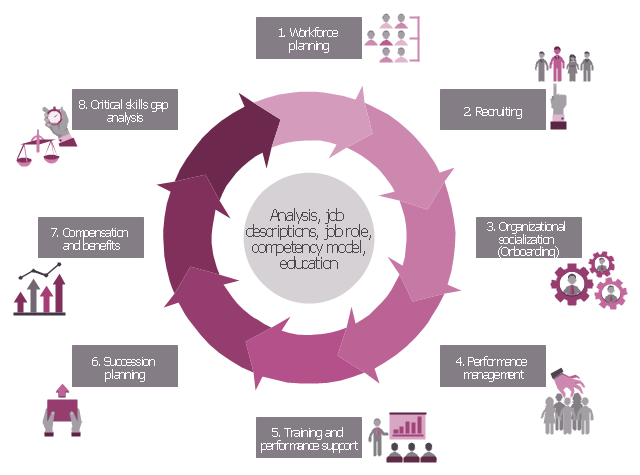
HR infographics "Talent management process" was redesigned from the Wikimedia Commons file: Model_ TM.jpg. [commons.wikimedia.org/ wiki/ File:Model_ TM.jpg]
"Talent management refers to the anticipation of required human capital for an organization and the planning to meet those needs. ...
Talent management is the science of using strategic human resource planning to improve business value and to make it possible for companies and organizations to reach their goals. Everything done to recruit, retain, develop, reward and make people perform forms a part of talent management as well as strategic workforce planning. A talent-management strategy needs to link to business strategy to make sense." [Talent management. Wikipedia]
The HR infographics example "Talent management process" was created using the ConceptDraw PRO diagramming and vector drawing software extended with the HR Flowcharts solution from the Management area of ConceptDraw Solution Park.
HR infographics
Excellent Examples of Infographic Maps

- Succession Planning Process Infographic
- Best Human Resource Planning Process Infographic
- Human Resource Planning Process Wikipedia
- Marketing Plan Infographic | Gant Chart in Project Management ...
- Marketing Plan Infographic | Target Diagram | Flowchart Marketing ...
- Job Portal Working Process Infographics
- Training Process Infographics
- Process Flowchart | Marketing Plan Infographic | Mind Maps for ...
- What are Infographic Area | School and Training Plans ...
- Process Flowchart | Marketing Plan Infographic | Target Diagram ...
- Marketing Plan Infographic | Target and Circular Diagrams | Target ...
- Process Flowchart | Marketing Plan Infographic | SWOT Analysis ...
- Hr Process Infographic Element
- Process Flowchart | PM Planning | What are Infographic Area | Send ...
- Marketing Plan Infographic | HVAC Marketing Plan | Marketing plan ...
- Learning Process Infographics
- Human Resources Planning Process Diagram
- Marketing Plan Gantt Chart Example
- Hr Infographics