HelpDesk
How to Draw a Pictorial Chart in ConceptDraw PRO

How to Draw Pictorial Chart. How to Use Infograms

Sample Pictorial Chart. Sample Infographics
")
Pictorial Chart

Design Pictorial Infographics. Design Infographics

Basic Diagramming


The vector stencils library "Picture Graphs" contains 35 templates of picture bar graphs for visual data comparison and time series.
Drag a template from the library to your document, set bars number, type category labels, select bars and enter your data.
Use these shapes to draw your pictorial bar charts in the ConceptDraw PRO diagramming and vector drawing software.
The vector stencils library "Picture Graphs" is included in the Picture Graphs solution from the Graphs and Charts area of ConceptDraw Solution Park.
Arrow
Water drop

Food

Grain

Agriculture

Medicines

Houses

Buildings

Money bags

Oil barrels

Natural gas

Electrical power

Nuclear power

Mechanical engineering

Chemical industry

Mining

Gold bars

Coins

Person

Men, women and children

Man

Woman

Child

Milk

Meat

Fruits

Vegetables

Computer

Mobile phone

Airliner

Car

Bus

Truck

Train

Cargo ship

The vector stencils library "Picture bar graphs" contains 35 templates of pictorial charts. Use it for visualization of data comparison and time series with ConceptDraw PRO diagramming and vector drawing software.
"Pictorial bar graph.
Sometimes reffered to as a pictographs. A pictorial bar graph is a graph in which the rectangular bars have been filled with pictures, sketches, icons, etc. or where pictures, sketches, icons, etc. have been substituted for the rectangular bars. In both variations, one or more symbols might be used in each bar. The two major reasons for using pictorial graphs are to make the graph more appealing visually and to facilitate better communications." [Information Graphics: A Comprehensive Illustrated Reference. R. L. Harris. 1999. p.41]
The pictorial charts example "Design elements - Picture bar graphs" is included in the Picture Graphs solution from the Graphs and Charts area of ConceptDraw Solution Park.
Templates

Infographic Maker

Map Software

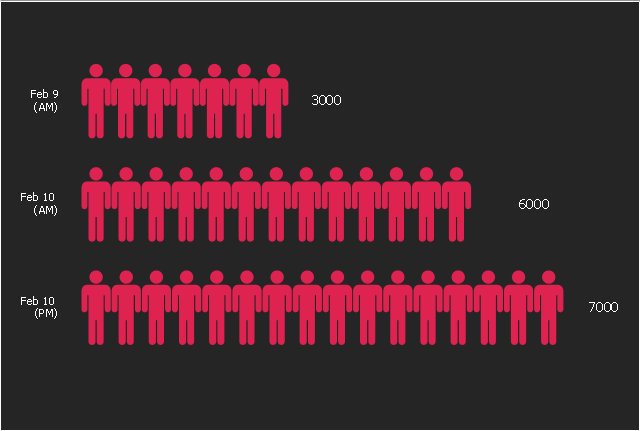
This picture bar graph sample shows increse in subscibers on YouTube to Anonymous' videos in 2008. It was designed on the base of the Wikimedia Commons file: A graph to show the increse in subscibers on YouTube to Anonymous' videos.jpg. [commons.wikimedia.org/ wiki/ File:A_ graph_ to_ show_ the_ increse_ in_ subscibers_ on_ YouTube_ to_ Anonymous%27_ videos.jpg]
This file is licensed under the Creative Commons Attribution 3.0 Unported license. [creativecommons.org/ licenses/ by/ 3.0/ deed.en]
"Anonymous (used as a mass noun) is a loosely associated international network of activist and hacktivist entities. A website nominally associated with the group describes it as "an internet gathering" with "a very loose and decentralized command structure that operates on ideas rather than directives". The group became known for a series of well-publicized publicity stunts and distributed denial-of-service (DDoS) attacks on government, religious, and corporate websites.
Anonymous originated in 2003 on the imageboard 4chan, representing the concept of many online and offline community users simultaneously existing as an anarchic, digitized global brain. Anonymous members (known as "Anons") can be distinguished in public by the wearing of stylised Guy Fawkes masks." [Anonymous (group). Wikipedia]
The pictorial chart example "The increse in subscibers on YouTube to Anonymous' videos" was created using the ConceptDraw PRO diagramming and vector drawing software extended with the Picture Graphs solution from the Graphs and Charts area of ConceptDraw Solution Park.
Image chart
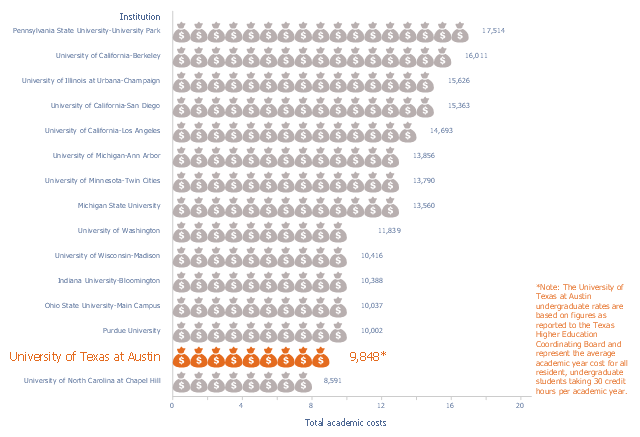
This picture bar graph sample shows the UT Austin Tuition Ranks 6th Compared to Other Texas Public Universities (Tuition and fees per semester, fall 2015). It was designed using data of the diagram "Compare UT Tuition" from the website of the University of Texas at Austin.
[tuition.utexas.edu/ compare]
The pictorial chart "Academic costs for residents, 2015-16" was created using the ConceptDraw PRO diagramming and vector drawing software extended with the Picture Graphs solution from the Graphs and Charts area of ConceptDraw Solution Park.
[tuition.utexas.edu/ compare]
The pictorial chart "Academic costs for residents, 2015-16" was created using the ConceptDraw PRO diagramming and vector drawing software extended with the Picture Graphs solution from the Graphs and Charts area of ConceptDraw Solution Park.
Pictorial chart
This pictorial chart sample shows the population growth by continent in 2010-2013.
"Population growth' refers to the growth in human populations. Global population growth is around 80 million annually, or 1.2% p.a. The global population has grown from 1 billion in 1800 to 7 billion in 2012. It is expected to keep growing to reach 11 billion by the end of the century. Most of the growth occurs in the nations with the most poverty, showing the direct link between high population growth and low standards of living. The nations with high standards of living generally have low or zero rates of population growth. Australia's population growth is around 400,000 annually, or 1.8% p.a., which is nearly double the global average. It is caused mainly by very high immigration of around 200,000 p.a., the highest immigration rate in the world. Australia remains the only nation in the world with both high population growth and high standards of living." [Population growth. Wikipedia]
The image chart example "Population growth by continent, 2010 - 2013" was created using the ConceptDraw PRO diagramming and vector drawing software extended with the Basic Picture Graphs solution from the Graphs and Charts area of ConceptDraw Solution Park.
Image chart

This picture bar graph sample shows the computer and Internet use at home from 1984 to 2014. It was designed using data from website of the United States Census Bureau (USCB).
[census.gov/ content/ dam/ Census/ library/ visualizations/ 2016/ comm/ digital_ nation.png]
"Home automation is the residential extension of building automation and involves the control and automation of lighting, heating, ventilation, air conditioning (HVAC), appliances, and security. Modern systems generally consist of switches and sensors connected to a central hub sometimes called a "gateway" from which the system is controlled with a user interface that is interacted either with a wall-mounted terminal, mobile phone software, tablet computer or a web interface." [Home automation. Wikipedia]
The pictorial chart example "Computer and Internet use at home over time" was created using the ConceptDraw PRO diagramming and vector drawing software extended with the Picture Graphs solution from the Graphs and Charts area of ConceptDraw Solution Park.
Image chart

- How to Draw a Pictorial Chart in ConceptDraw PRO | How to Draw ...
- Design elements - Picture graphs | How to Draw Pictorial Chart . How ...
- How to Draw Pictorial Chart . How to Use Infograms | Sample ...
- Pictorial Chart
- Basic Diagramming | How to Draw a Pictorial Chart in ConceptDraw ...
- How to Draw Pictorial Chart . How to Use Infograms | Pictorial Chart ...
- Sample Pictorial Chart . Sample Infographics | Line Chart Examples ...
- How to Draw a Pictorial Chart in ConceptDraw PRO
- Sample Pictorial Chart . Sample Infographics | How to Draw Pictorial ...
- How to Draw Pictorial Chart . How to Use Infograms | Process ...
- Infographic Maker | Pictorial Chart | Population growth by continent ...
- How to Draw Pictorial Chart . How to Use Infograms | Floor Plans ...
- Basic Flowchart Symbols and Meaning | How to Draw Pictorial Chart ...
- How to Draw Pictorial Chart . How to Use Infograms | Sample ...
- Design Pictorial Infographics. Design Infographics | Sample Pictorial ...
- Pictorial Chart | Sport pictograms. Olympic Games | HR Flowchart ...
- How to Draw Pictorial Chart . How to Use Infograms | Basic Flowchart ...
- Sample Pictorial Chart . Sample Infographics | Pie Chart Examples ...
- Pictorial Flow Chart
- Blank Scatter Plot | How to Draw a Pictorial Chart in ConceptDraw ...