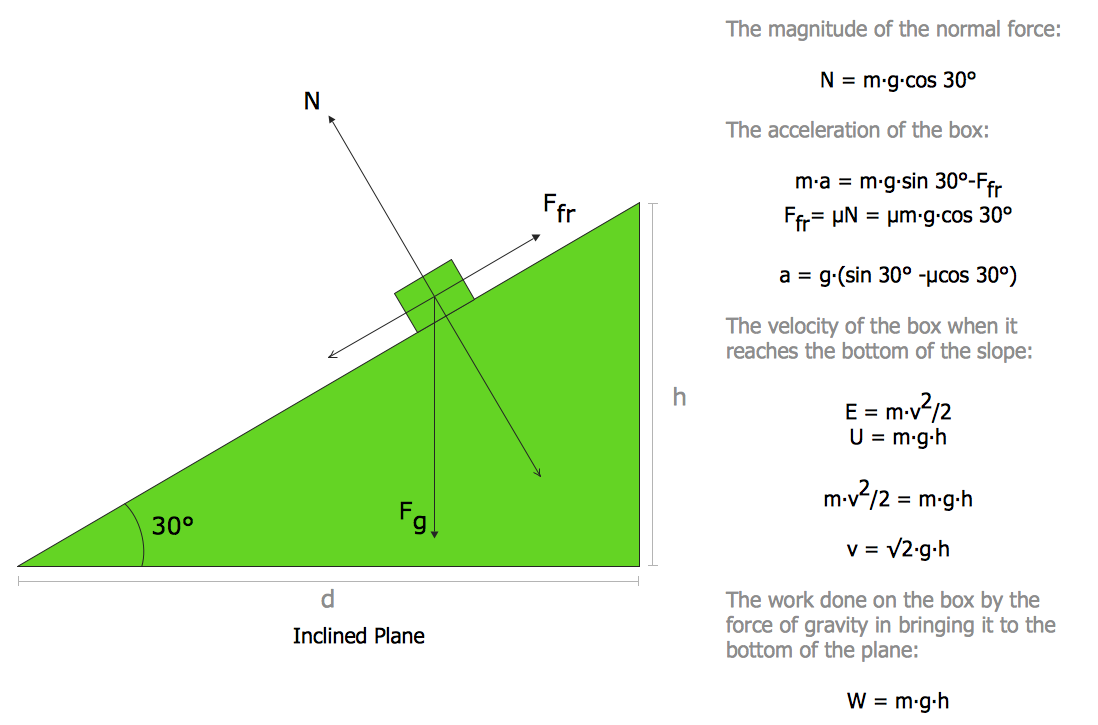
Physics Diagrams
ConceptDraw DIAGRAM diagramming and vector drawing software extended with Physics solution from the Science and Education area is the best for creating: physics diagrams, pictures which describe various physical facts and experiments, illustrations of various electrical, mechanical and optic processes, of any complexity quick and easy.HelpDesk
How to Draw Physics Diagrams
Nothing is more helpful in the study of physics as a visual representation of the physical processes: physics schemes, diagrams, and illustrations. Physics charts can be helpful when you learn Physics, perform experiments, or solve any other tasks regarding Physics. ConceptDraw DIAGRAM allows you to draw physical diagrams of mechanical, nuclear, optical and electrical processes using the set of vector physics symbols and physics diagram templates.Physics Symbols
ConceptDraw DIAGRAM diagramming and vector drawing software extended with Physics solution from the Science and Education area is a powerful software for creating various physics diagrams. Physics solution provides all tools that you can need for physics diagrams designing. It includes 3 libraries with predesigned vector physics symbols: Optics Library, Mechanics Library and Nuclear Physics Library.BPMN 2.0
ConceptDraw DIAGRAM diagramming and vector drawing software offers the Business Process Diagram Solution from the Business Processes Area of ConceptDraw Solution Park with powerful tools to help you easy represent the business processes and create the business process diagrams based on BPMN 2.0 standard.Mathematics Symbols
ConceptDraw DIAGRAM extended with Mathematics solution from the Science and Education area is a powerful diagramming and vector drawing software that offers all needed tools for mathematical diagrams designing. Mathematics solution provides 3 libraries with predesigned vector mathematics symbols and figures: Solid Geometry Library, Plane Geometry Library and Trigonometric Functions Library.
Physics
Physics solution extends ConceptDraw DIAGRAM software with templates, samples and libraries of vector stencils for drawing the physical illustrations, diagrams and charts.
Sales Process
ConceptDraw DIAGRAM is effective software for a variety of activity fields. Now, extended with Sales Flowcharts solution from the Marketing area of ConceptDraw Solution Park it become also useful in the field of sales. It helps to design professional looking Sales Flowcharts, Sales Process Flowcharts, Sales Process Maps, Plans and Diagrams to effectively realize the process of selling a product or service, and to display the sales results.Basic Diagramming
Mathematics is an exact science, which studies the values, spatial forms and quantitative relations. It is a science, in which is built large number of various diagrams, charts and graphs that present the material in a clear, visual and colorful form, help to analyze the information and to make certain conclusions. A diagram is a graphical representation of data using the linear segments or geometric shapes, which allows to evaluate the ratio of several values. Depending on the types of solved tasks are used the diagrams of different kinds. A graph is a diagram that shows quantitative dependencies of various processes using the curves. ConceptDraw DIAGRAM is a powerful intelligent and multifunctional vector engine for drawing different Mathematical diagrams and graphs, Mathematical illustrations, complex and simple Diagram mathematics, Flowcharts of equation solving process, Line graphs, Scatter plots, Histograms, Block diagrams, Bar charts, Divided bar diagrams, Pie charts, Area charts, Circular arrows diagrams, Venn diagrams, Bubble diagrams, Concept maps, and many others.
Astronomy and Astrology
Astronomy and astrology require from the specialists permanent drawing wide variety of illustrations, sketches. It’s convenient for astronomers and astrologers to have software that will help design them quick and easy. ConceptDraw DIAGRAM diagramming and vector drawing software extended with Astronomy solution from the Science and Education area is exactly what they need.HelpDesk
How to Draw a Circular Arrows Diagram
The cyclic recurrence is a fundamental property of multiple systems. The cycle is a process which consists from elements (phases, stages, stages) following each other. Many processes in astronomy, biology, chemistry, physics, mathematics, etc. have a cycle properties. It is also widely used in information technologies and marketing analysis. Graphical representation of cyclic processes can have many forms. It can be a circle, parabola, hyperbola, ellipse and others. A Circular Arrows Diagram is used as one of the statistical charts in the business, mass media and marketing. ConceptDraw DIAGRAM provides its users tools for making easy drawing Circular Arrows Diagrams.- Vector Draw Tool Math
- Mechanical Engineering | Apparatus Of Physics Drawing
- Biology Drawing Software | Physics Diagrams | Chemistry Drawing ...
- Vector Diagram Creator
- Physics Diagrams | Physics Symbols | How to Draw Physics ...
- Best Vector Drawing Application for Mac OS X | Chemical ...
- How to Draw Physics Diagrams in ConceptDraw PRO | Physics ...
- Physics Diagrams | Physics Symbols | Line Chart Template for Word ...
- Best Online Tool To Draw Maths And Physics Diagram
- Physics Diagrams | Physics Symbols | Basic Diagramming | Best ...