Physics Diagrams
Line Chart Template for Word

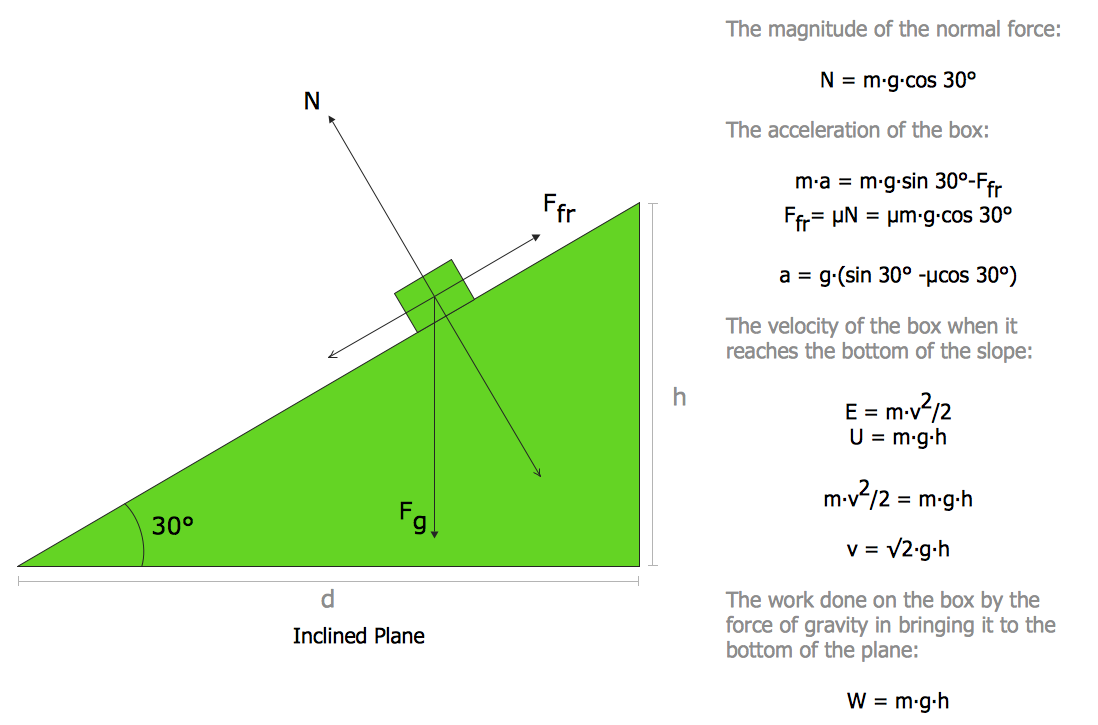
 Physics
Physics solution extends ConceptDraw DIAGRAM software with templates, samples and libraries of vector stencils for drawing the physical illustrations, diagrams and charts.
Physics Symbols

Basic Diagramming


Flowchart Programming Project. Flowchart Examples

 Seating Plans
The Seating Plans solution including samples, seating chart templates and libraries of vector design elements assists in creating the Seating plans, Seating arrangement charts, Chair layout designs, Plan drawings of cinema seating, Movie theater chair plans, extensive Cinema theater plans depicting the seating arrangement in the cinema halls, location of closet, cafe and food sale area, in designing the Seating plans for the large seating areas, Seat plan designs for airplanes, trains, etc. Use any of the included samples as the table seating chart template or seating chart template free and achieve professional drawing results in a few minutes.
How To Create Onion Diagram

 Network Layout Floor Plans
Network Layout Floor Plans solution extends ConceptDraw DIAGRAM software functionality with powerful tools for quick and efficient documentation the network equipment and displaying its location on the professionally designed Network Layout Floor Plans. Never before creation of Network Layout Floor Plans, Network Communication Plans, Network Topologies Plans and Network Topology Maps was not so easy, convenient and fast as with predesigned templates, samples, examples and comprehensive set of vector design elements included to the Network Layout Floor Plans solution. All listed types of plans will be a good support for the future correct cabling and installation of network equipment.
 Bubble Diagrams
Bubble diagrams have enjoyed great success in software engineering, architecture, economics, medicine, landscape design, scientific and educational process, for ideas organization during brainstorming, for making business illustrations, presentations, planning, design, and strategy development. They are popular because of their simplicity and their powerful visual communication attributes.
- Math Graph Maker Online
- Polar Graph | Physics Diagrams | Bar Chart Software | Math Graph ...
- Physics Diagrams | How to Draw Physics Diagrams in ConceptDraw ...
- Physics Diagram Maker Online
- Value Stream Mapping | Online Math Graph Maker
- Top 5 Android Flow Chart Apps | Graph Maker
- Science Graph Maker
- Pareto Chart Maker Online
- Polar Graph | Physics Diagrams | Process Flowchart | Maths Graph ...