 Physics
Physics solution extends ConceptDraw DIAGRAM software with templates, samples and libraries of vector stencils for drawing the physical illustrations, diagrams and charts.
HelpDesk
How to Draw Physics Diagrams

Physics Diagrams

Physics Symbols

Workflow Diagram Symbols

Mathematics Symbols

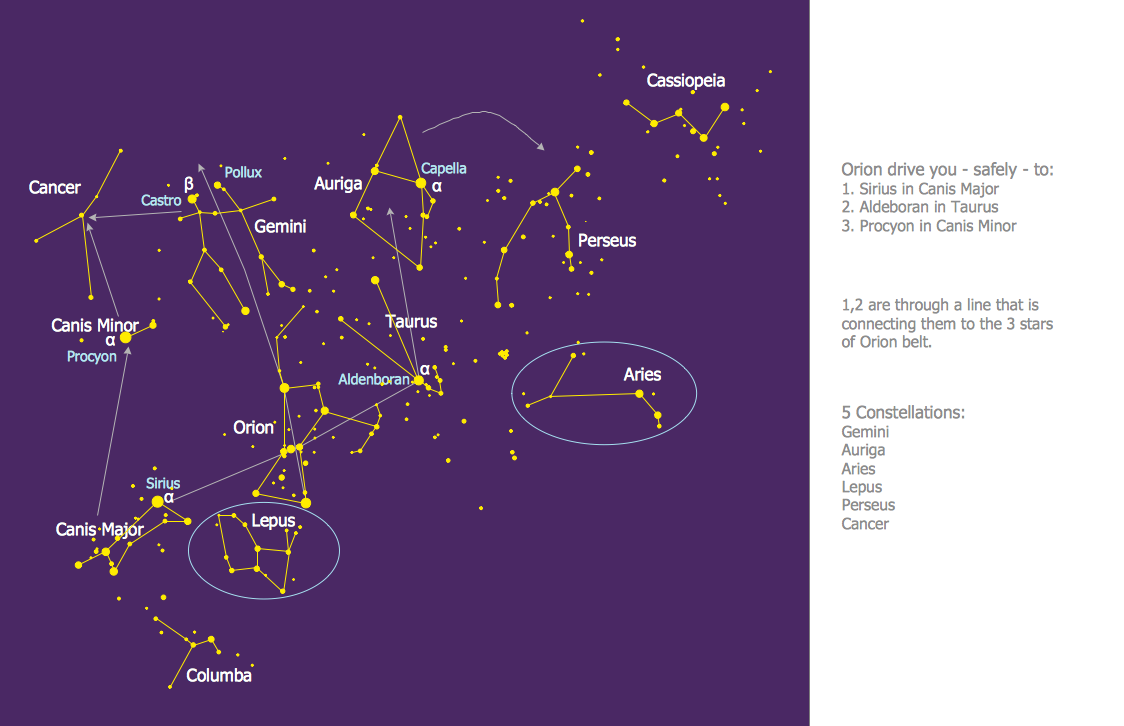
Constellation Chart
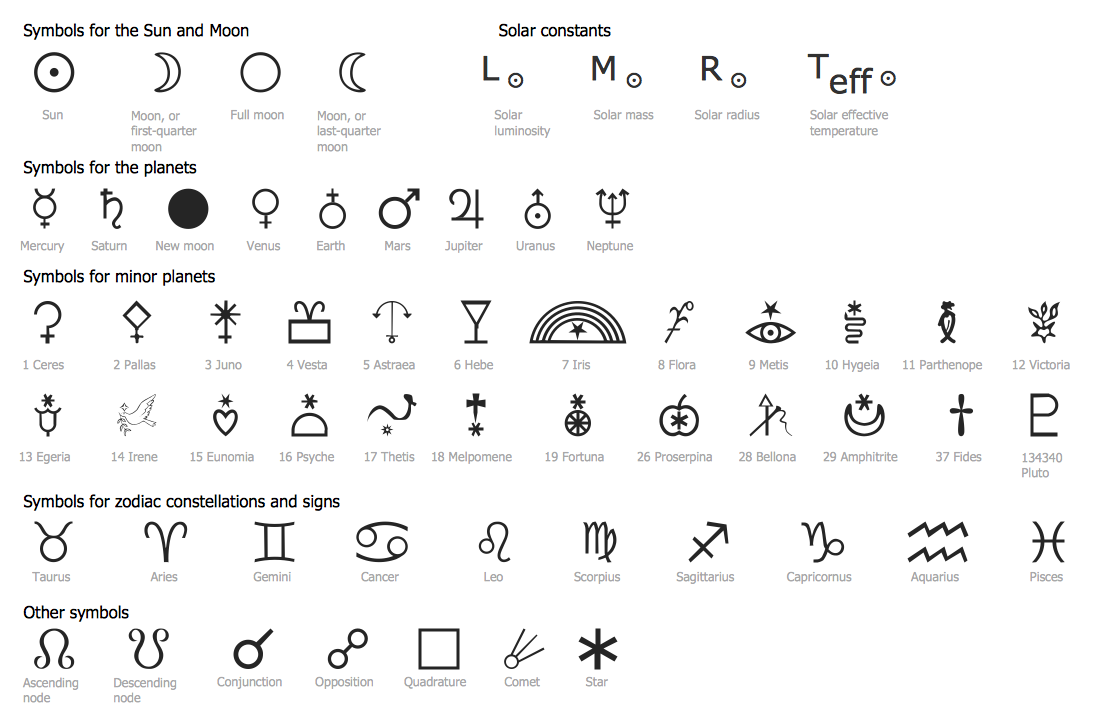
Astronomy Symbols
HelpDesk
How to Draw a Circular Arrows Diagram

Line Chart Template for Word

Flow Map

 ConceptDraw Solution Park
ConceptDraw Solution Park collects graphic extensions, examples and learning materials
 Education
This solution extends ConceptDraw DIAGRAM and ConceptDraw MINDMAP with specific content that helps illustrate educational documents, presentations, and websites quickly and easily with astronomy, chemistry, math and physics vector pictures and clip art.
 Fire and Emergency Plans
It's a good idea to have an emergency exit strategy in place for your home or business. ConceptDraw gives you the tools to create your own fire and emergency plan, tailored to your setting.
 Business Infographics Area
ConceptDraw Business Infographics Solutions helps you to design eye-catching marketing infographics, on subjects such as content marketing, education, IT, social media marketing, and marketing plans; allowing you to represent, share and explain various pi
- How to Draw Physics Diagrams in ConceptDraw PRO | Physics ...
- How to Draw Physics Diagrams in ConceptDraw PRO | Design ...
- How to Draw Physics Diagrams in ConceptDraw PRO | Physics ...
- How to Draw Physics Diagrams in ConceptDraw PRO | Simple Flow ...
- How to Draw Physics Diagrams in ConceptDraw PRO | Mechanical ...
- How to Draw Physics Diagrams in ConceptDraw PRO | How to Draw ...
- How to Draw Physics Diagrams in ConceptDraw PRO ...
- How to Draw Physics Diagrams in ConceptDraw PRO | Flowcharts ...
- How to Draw Physics Diagrams in ConceptDraw PRO | Flowchart ...
- How to Draw Physics Diagrams in ConceptDraw PRO | The Best ...
- How to Draw Physics Diagrams in ConceptDraw PRO | Biology ...
- How to Draw Biology Diagram in ConceptDraw PRO | How to Draw ...
- How to Draw Physics Diagrams in ConceptDraw PRO | Cisco ...
- How to Draw Physics Diagrams in ConceptDraw PRO | Nature ...
- How to Draw Physics Diagrams in ConceptDraw PRO | Business ...
- Physics Diagrams | Physics Symbols | How to Draw Physics ...
- Physics Diagrams | Physics Symbols | Astronomy Symbols | Drawing ...
- Physics Diagrams | How to Draw Physics Diagrams in ConceptDraw ...
- Physics Symbols | How to Draw Physics Diagrams in ConceptDraw ...
- Chemistry Drawings | How to Draw Physics Diagrams in ...