"Subjective performance evaluation allows the use of a subtler, more balanced assessment of employee performance, and is typically used for more complex jobs where comprehensive objective measures are difficult to specify and/ or measure. Whilst often the only feasible method, the attendant problems with subjective performance evaluation have resulted in a variety of incentive structures and supervisory schemes. One problem, for example, is that supervisors may under-report performance in order to save on wages, if they are in some way residual claimants, or perhaps rewarded on the basis of cost savings. This tendency is of course to some extent offset by the danger of retaliation and/ or demotivation of the employee, if the supervisor is responsible for that employee’s output. ...
Another problem relates to what is known as the "compression of ratings". Two related influences—centrality bias, and leniency bias—have been documented ... The former results from supervisors being reluctant to distinguish critically between workers (perhaps for fear of destroying team spirit), while the latter derives from supervisors being averse to offering poor ratings to subordinates, especially where these ratings are used to determine pay, not least because bad evaluations may be demotivating rather than motivating. However, these biases introduce noise into the relationship between pay and effort, reducing the incentive effect of performance-related pay. ... this is the reason for the common separation of evaluations and pay, with evaluations primarily used to allocate training.
Finally, while the problem of compression of ratings originates on the supervisor-side, related effects occur when workers actively attempt to influence the appraisals supervisors give, either by influencing the performance information going to the supervisor: multitasking (focussing on the more visibly productive activities...), or by working “too hard” to signal worker quality or create a good impression...; or by influencing the evaluation of it, e.g., by "currying influence"... or by outright bribery..." [Principal–agent problem. Wikipedia]
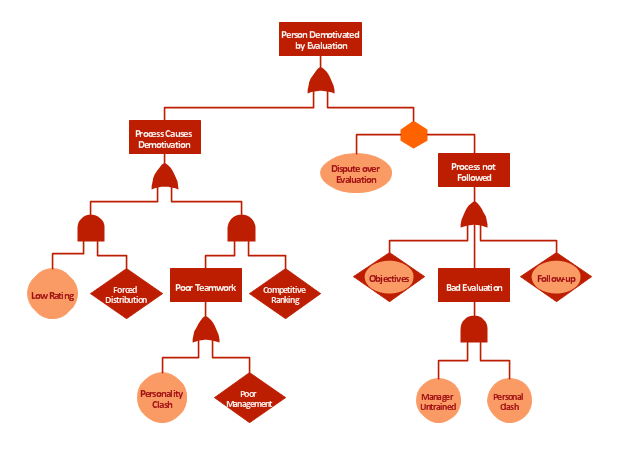
The example "Person demotivated by evaluation - Fault tree analysis diagram" was created using the ConceptDraw PRO diagramming and vector drawing software extended with the Fault Tree Analysis Diagrams solution from the Engineering area of ConceptDraw Solution Park.
Another problem relates to what is known as the "compression of ratings". Two related influences—centrality bias, and leniency bias—have been documented ... The former results from supervisors being reluctant to distinguish critically between workers (perhaps for fear of destroying team spirit), while the latter derives from supervisors being averse to offering poor ratings to subordinates, especially where these ratings are used to determine pay, not least because bad evaluations may be demotivating rather than motivating. However, these biases introduce noise into the relationship between pay and effort, reducing the incentive effect of performance-related pay. ... this is the reason for the common separation of evaluations and pay, with evaluations primarily used to allocate training.
Finally, while the problem of compression of ratings originates on the supervisor-side, related effects occur when workers actively attempt to influence the appraisals supervisors give, either by influencing the performance information going to the supervisor: multitasking (focussing on the more visibly productive activities...), or by working “too hard” to signal worker quality or create a good impression...; or by influencing the evaluation of it, e.g., by "currying influence"... or by outright bribery..." [Principal–agent problem. Wikipedia]
The example "Person demotivated by evaluation - Fault tree analysis diagram" was created using the ConceptDraw PRO diagramming and vector drawing software extended with the Fault Tree Analysis Diagrams solution from the Engineering area of ConceptDraw Solution Park.
FTA diagram
Cross-Functional Flowchart


"A project manager is the person responsible for accomplishing the stated project objectives. Key project management responsibilities include creating clear and attainable project objectives, building the project requirements, and managing the constraints of the project management triangle, which are cost, time, scope, and quality.
A project manager is often a client representative and has to determine and implement the exact needs of the client, based on knowledge of the firm they are representing. A project manager is the bridging gap between the production team and client. So he/ she must have a fair knowledge of the industry they are in so that they are capable of understanding and discussing the problems with either party. The ability to adapt to the various internal procedures of the contracting party, and to form close links with the nominated representatives, is essential in ensuring that the key issues of cost, time, quality and above all, client satisfaction, can be realized.
The term and title 'project manager' has come to be used generically to describe anyone given responsibility to complete a project. However, it is more properly used to describe a person with full responsibility and the same level of authority required to complete a project. If a person does not have high levels of both responsibility and authority then they are better described as a project administrator, coordinator, facilitator or expeditor." [Project manager. Wikipedia]
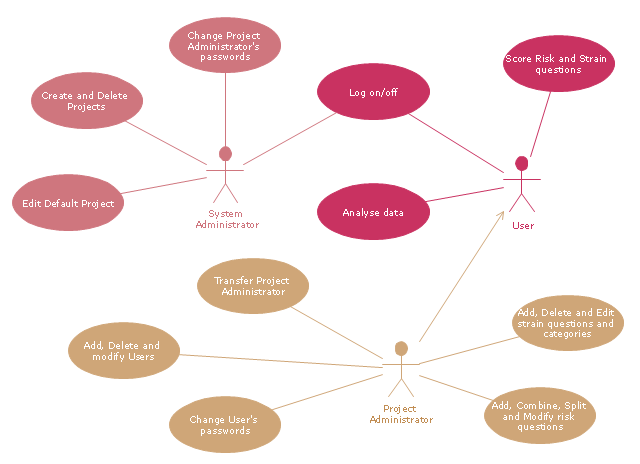
The UML use case diagram example "Project administrator" was created using the ConceptDraw PRO diagramming and vector drawing software extended with the Rapid UML solution from the Software Development area of ConceptDraw Solution Park.
A project manager is often a client representative and has to determine and implement the exact needs of the client, based on knowledge of the firm they are representing. A project manager is the bridging gap between the production team and client. So he/ she must have a fair knowledge of the industry they are in so that they are capable of understanding and discussing the problems with either party. The ability to adapt to the various internal procedures of the contracting party, and to form close links with the nominated representatives, is essential in ensuring that the key issues of cost, time, quality and above all, client satisfaction, can be realized.
The term and title 'project manager' has come to be used generically to describe anyone given responsibility to complete a project. However, it is more properly used to describe a person with full responsibility and the same level of authority required to complete a project. If a person does not have high levels of both responsibility and authority then they are better described as a project administrator, coordinator, facilitator or expeditor." [Project manager. Wikipedia]
The UML use case diagram example "Project administrator" was created using the ConceptDraw PRO diagramming and vector drawing software extended with the Rapid UML solution from the Software Development area of ConceptDraw Solution Park.
UML use case diagram
Cisco People. Cisco icons, shapes, stencils and symbols
")
Express-G Diagram

Types of Flowchart - Overview


"A schedule or timetable is a basic time management tool consisting of a list of times at which possible tasks, events, or actions are intended to take place, or a sequence of events in the chronological order in which such things are intended to take place. The process of creating a schedule - deciding how to order these tasks and how to commit resources between the variety of possible tasks - is called scheduling, and a person responsible for making a particular schedule may be called a scheduler. Making and following schedules is a fundamental human activity, and learning to do these things effectively is one of the most basic life skills. There are a wide variety of situations in which schedules are necessary, or at least useful.
Schedules are useful for both short periods, such as a daily or weekly schedule, and for long term planning with respect to periods of several months or years. They are often made using a calendar, where the person making the schedule can note the dates and times at which various events are planned to occur. Schedules that do not set forth specific times for events to occur may instead list an expected order in which events either can or must take place." [Schedule. Wikipedia]
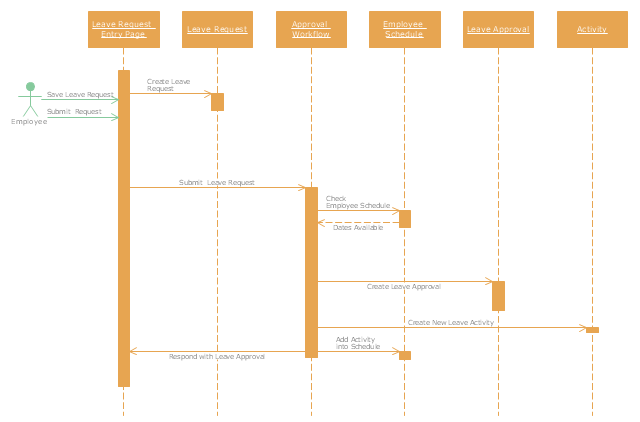
The UML sequence diagram example "Checking process" was created using the ConceptDraw PRO diagramming and vector drawing software extended with the Rapid UML solution from the Software Development area of ConceptDraw Solution Park.
Schedules are useful for both short periods, such as a daily or weekly schedule, and for long term planning with respect to periods of several months or years. They are often made using a calendar, where the person making the schedule can note the dates and times at which various events are planned to occur. Schedules that do not set forth specific times for events to occur may instead list an expected order in which events either can or must take place." [Schedule. Wikipedia]
The UML sequence diagram example "Checking process" was created using the ConceptDraw PRO diagramming and vector drawing software extended with the Rapid UML solution from the Software Development area of ConceptDraw Solution Park.
UML sequence diagram
The vector stencils library "Workflow diagrams" contains 54 symbol icons of workflow diagrams.
The workflow diagrams represent information flow, automation of business processes, business process re-engineering, accounting, management, and human resources tasks in industry, business, and manufacturing.
Use this library to draw workflow diagrams in the ConceptDraw PRO diagramming and vector drawing software extended with the Workflow Diagrams solution from the Business Processes area of ConceptDraw Solution Park.
www.conceptdraw.com/ solution-park/ business-process-workflow-diagrams
Accounting

Accounts Payable

Accounts Receivable

Bank

Board of Directors

Copy Center

Customer Service

Distribution

Finance

Information Systems

International Division

International Marketing

International Sales

Inventory

Legal Department

Mailroom 2

Mailroom 1

Management

Manufacturing

Marketing

Motor Pool

Packaging

Payroll

Person 1

Person 2

Personnel/ Staff

Publications

Purchasing

Quality Assurance

Exchange

Reception

Research and Development

Sale contract

Shipping

Suppliers

Telecommunications

Treasurer

Warehouse

Lorry

Quality

Production

Box

Boxes

Open box

Payment

Receiving

Sales

Phone

Operator 1

Online booking

Operator 2

Server

Car

Mini truck

Basic Flowchart Symbols and Meaning


HelpDesk
Event-driven Process Chain (EPC) Diagram Software

Column Chart Software

Swim Lane Flowchart Symbols

"Authentication ... is the act of confirming the truth of an attribute of a single piece of data (datum) or entity. In contrast with Identification which refers to the act of stating or otherwise indicating a claim purportedly attesting to a person or thing's identity, Authentication is the process of actually confirming that identity. It might involve confirming the identity of a person by validating their identity documents, verifying the validity of a website with a digital certificate, tracing the age of an artifact by carbon dating, or ensuring that a product is what its packaging and labeling claim to be. In other words, Authentication often involves verifying the validity of at least one form of identification." [Authentication. Wikipedia]
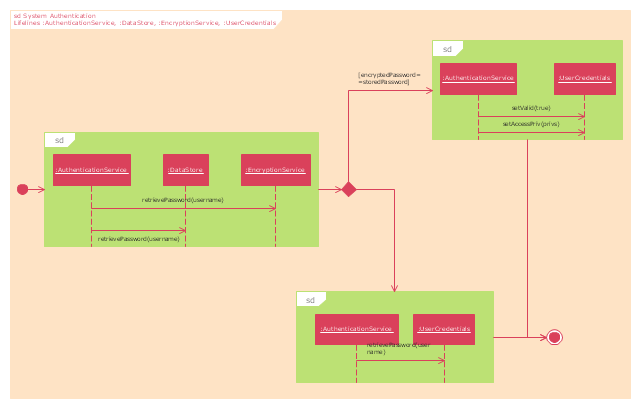
The UML interaction overview diagram example "System authentication" was created using the ConceptDraw PRO diagramming and vector drawing software extended with the Rapid UML solution from the Software Development area of ConceptDraw Solution Park.
The UML interaction overview diagram example "System authentication" was created using the ConceptDraw PRO diagramming and vector drawing software extended with the Rapid UML solution from the Software Development area of ConceptDraw Solution Park.
UML interaction overview diagram
- Authority Matrix Diagram Software | Person involvement matrix ...
- Person demotivated by evaluation - Fault tree analysis diagram ...
- Organogram Software | Person involvement matrix - Template ...
- Person demotivated by evaluation - Fault tree analysis diagram
- Influence Diagram | Influence Diagram Software | Person ...
- Cisco Person Diagram
- SWOT analysis matrix diagram templates | Swot Analysis Example ...
- How To Create an Involvement Matrix | CORRECTIVE ACTIONS ...
- SWOT analysis matrix diagram templates | SWOT Matrix Template ...
- Computer Person Clipart For Architecture Diagram
- SWOT analysis matrix diagram templates | SWOT Matrix Software ...
- The Action Plan | CORRECTIVE ACTIONS PLANNING. Involvement ...
- Person involvement matrix - Template | Responsibility assignment ...
- Software for Creating SWOT Analysis Diagrams | SWOT analysis ...
- Diagrams For Human Resource Accounting
- Recruitment | Hiring Process | Business process diagram BPMN 1.2 ...
- HR Flowcharts | Onboarding model | Business process diagram ...
- Business process diagram BPMN 1.2 - Hiring process | How to Draw ...
- Business process diagram BPMN 1.2 - Hiring process | HR ...
- Business process diagram BPMN 1.2 - Hiring process | Recruitment ...