Pyramid Diagram

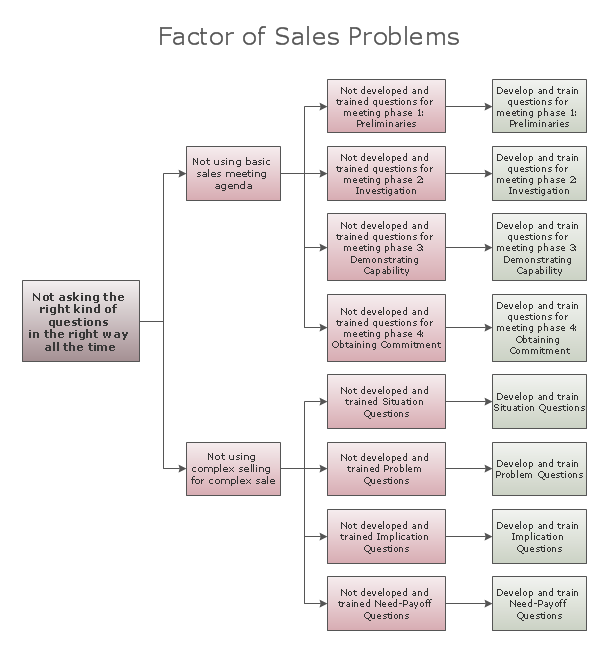
Root Cause Tree Diagram
Create a Presentation Using a Design Template

Authority Matrix Diagram Software

Work Order Process Flowchart. Business Process Mapping Examples

Flowchart Definition

Horizontal Flowchart

 Project Management Area
Project Management area provides Toolbox solutions to support solving issues related to planning, tracking, milestones, events, resource usage, and other typical project management functions.
Marketing Analysis Diagram

 HR Flowcharts
Human resource management diagrams show recruitment models, the hiring process and human resource development of human resources.
- Matrix Organization Structure | Organizational Structure | How to ...
- Pyramid Diagram | Organizational Structure Total Quality ...
- Download Organizational Chart Template For Word
- Matrix Organization Structure | New business opportunity SWOT ...
- Organizational Structure Total Quality Management | Affinity ...
- Flow Chart Symbols | Process Flowchart | Basic Flowchart Symbols ...
- Stakeholder Onion Diagram Template | Organizational Chart ...
- Accounting Department Organizational Chart
- Branch Chart Creator
- Mindmap Organizational Systems