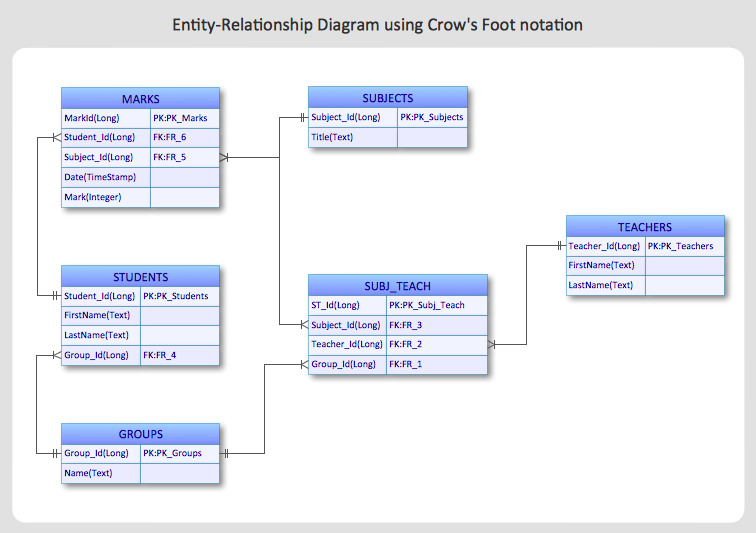
 Entity-Relationship Diagram (ERD)
Entity-Relationship Diagram (ERD) solution extends ConceptDraw PRO software with templates, samples and libraries of vector stencils from drawing the ER-diagrams by Chen's and crow’s foot notations.
 Fault Tree Analysis Diagrams
This solution extends ConceptDraw PRO v9.5 or later with templates, fault tree analysis example, samples and a library of vector design elements for drawing FTA diagrams (or negative analytical trees), cause and effect diagrams and fault tree diagrams.
HelpDesk
How to Create an Entity-Relationship Diagram Using ConceptDraw Solution Park
An entity-relationship diagram (ERD)is used in a database modeling process. ERD diagram shows a graphical representation of objects or concepts within an information system and their relationships.The ability to describe a database using the Entity-Relationship model is delivered by the ConceptDraw ERD solution."Crow's Foot notation is used in Barker's Notation, SSADM and Information Engineering. Crow's Foot diagrams represent entities as boxes, and relationships as lines between the boxes. Different shapes at the ends of these lines represent the cardinality of the relationship." [Entity–relationship model. Wikipedia]
The vector stencils library ERD, crow's foot notation contains 17 symbols for creating the ER-diagrams using the ConceptDraw PRO diagramming nd vector drawing software.
The example"Design elements - ERD solution (crow's foot notation)" is included in the Entity-Relationship Diagram (ERD) solution from the Software Development area of ConceptDraw Solution Park.
 Cross-Functional Flowcharts
Cross-functional flowcharts are powerful and useful tool for visualizing and analyzing complex business processes which requires involvement of multiple people, teams or even departments. They let clearly represent a sequence of the process steps, the order of operations, relationships between processes and responsible functional units (such as departments or positions).
Data structure diagram with ConceptDraw PRO
Data structure diagram (DSD) is intended for description of conceptual models of data (concepts and connections between them) in the graphic format for more obviousness. Data structure diagram includes entities description, connections between them and obligatory conditions and requirements which connect them. Create Data structure diagram with ConceptDraw PRO.- Er Diagram Drawing Tool Online
- Design elements - ER diagram (Chen notation) | Entity-Relationship ...
- Entity Relationship Diagram Examples | Local area network (LAN ...
- Online Shopping Er Diagram Free Download
- Online Furniture Shopping E R Diagram
- Dfd Diagram Tools On Mac
- Block Diagrams | Entity-Relationship Diagram ( ERD ) | Fishbone ...
- Diagramming Software for Design UML Component Diagrams | UML ...
- Online Er Diagram Drawing Tool
- Erd For Online Gift Shop
- Entity-Relationship Diagram ( ERD ) | Eer Diagram Of Online ...
- ConceptDraw Solution Park | UML Component Diagram Example ...
- Entity-Relationship Diagram ( ERD ) | Data Flow Diagrams | Software ...
- ConceptDraw Solution Park | Online Diagram Tool | Entity ...
- Entity-Relationship Diagram ( ERD ) | Best E R Diagram For Online ...
- Online Diagram Tool | Flow Chart Online | ConceptDraw Solution ...
- Er Diagram Layout For Online Shopping
- UML Component Diagram Example - Online Shopping | UML ...
- UML Component Diagram Example - Online Shopping | UML Tool ...
- Entity-Relationship Diagram ( ERD ) | Online Shopping System Er ...

.png--diagram-flowchart-example.png)
