HelpDesk
How to Change the Timescale in a Gantt Chart View
Most views in ConceptDraw PROJECT Server have a timescale that shows the units of project time measurement (hour, day, week, etc.) used to schedule project tasks. You can change the timescale to view smaller or bigger time units, from hours all the way up to years. For example, you may want to show time in quarterы of the yearб or you may want to show a Gantt chart across months and days.HelpDesk
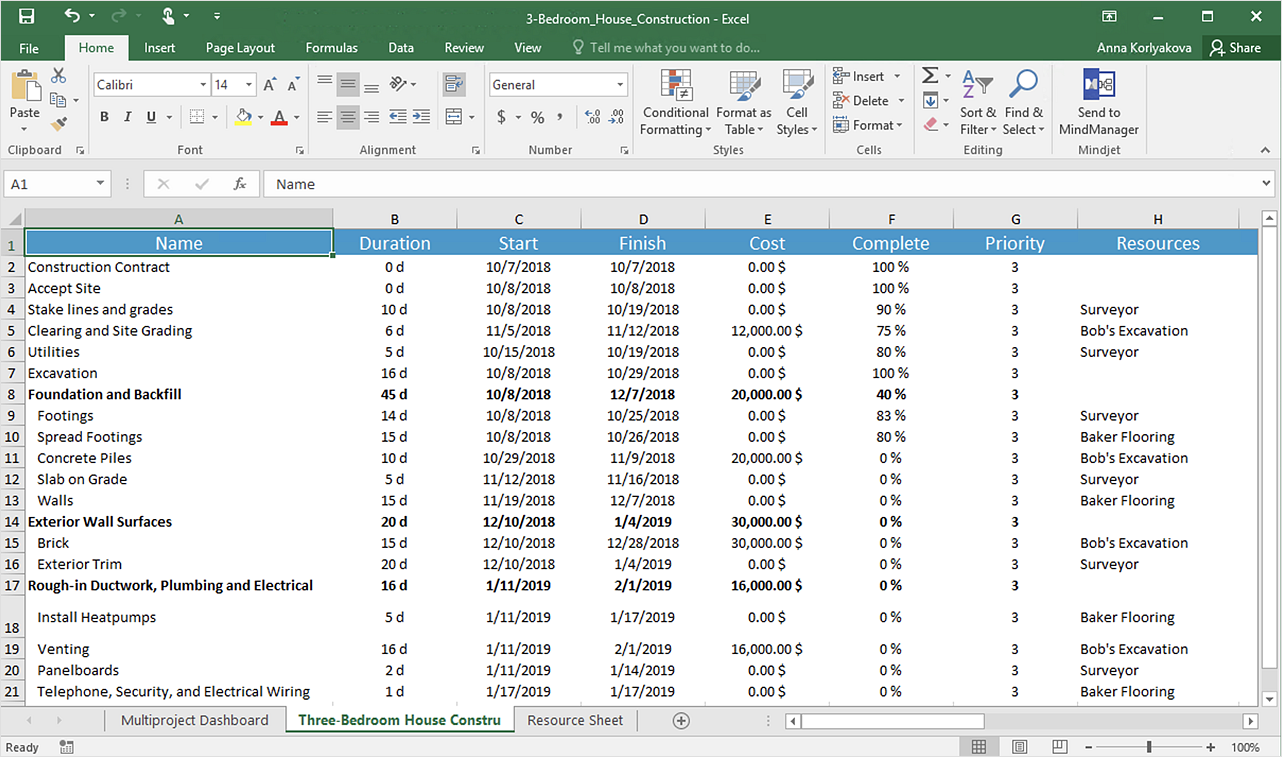
How to Export Project Data to MS Excel Worksheet
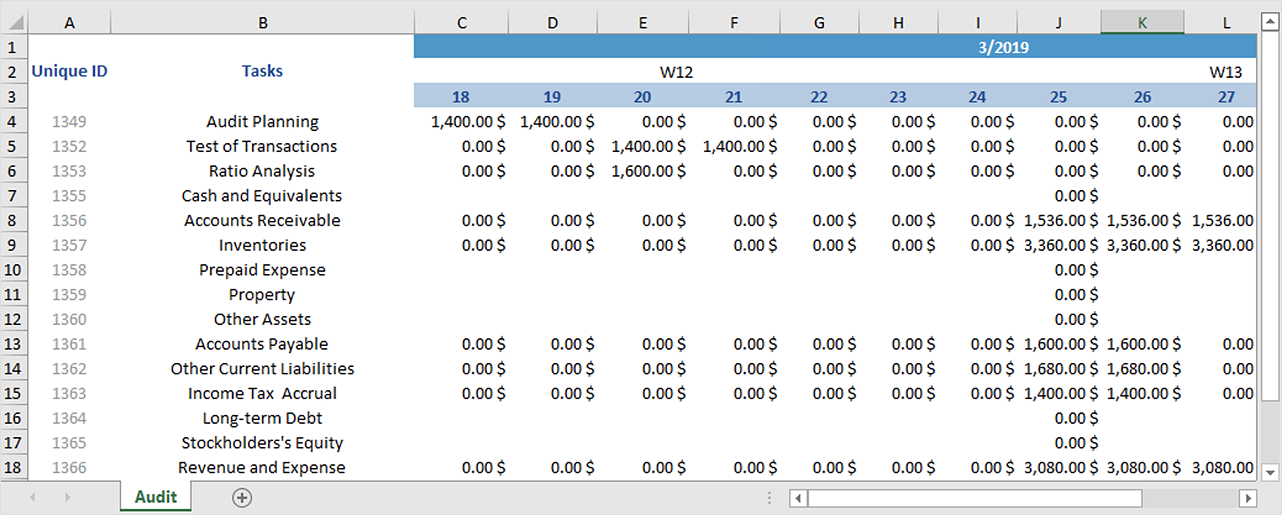
You can share your ConceptDraw PROJECT files with colleagues who use MS Excel®using the export capabilities of ConceptDraw PROJECT.HelpDesk
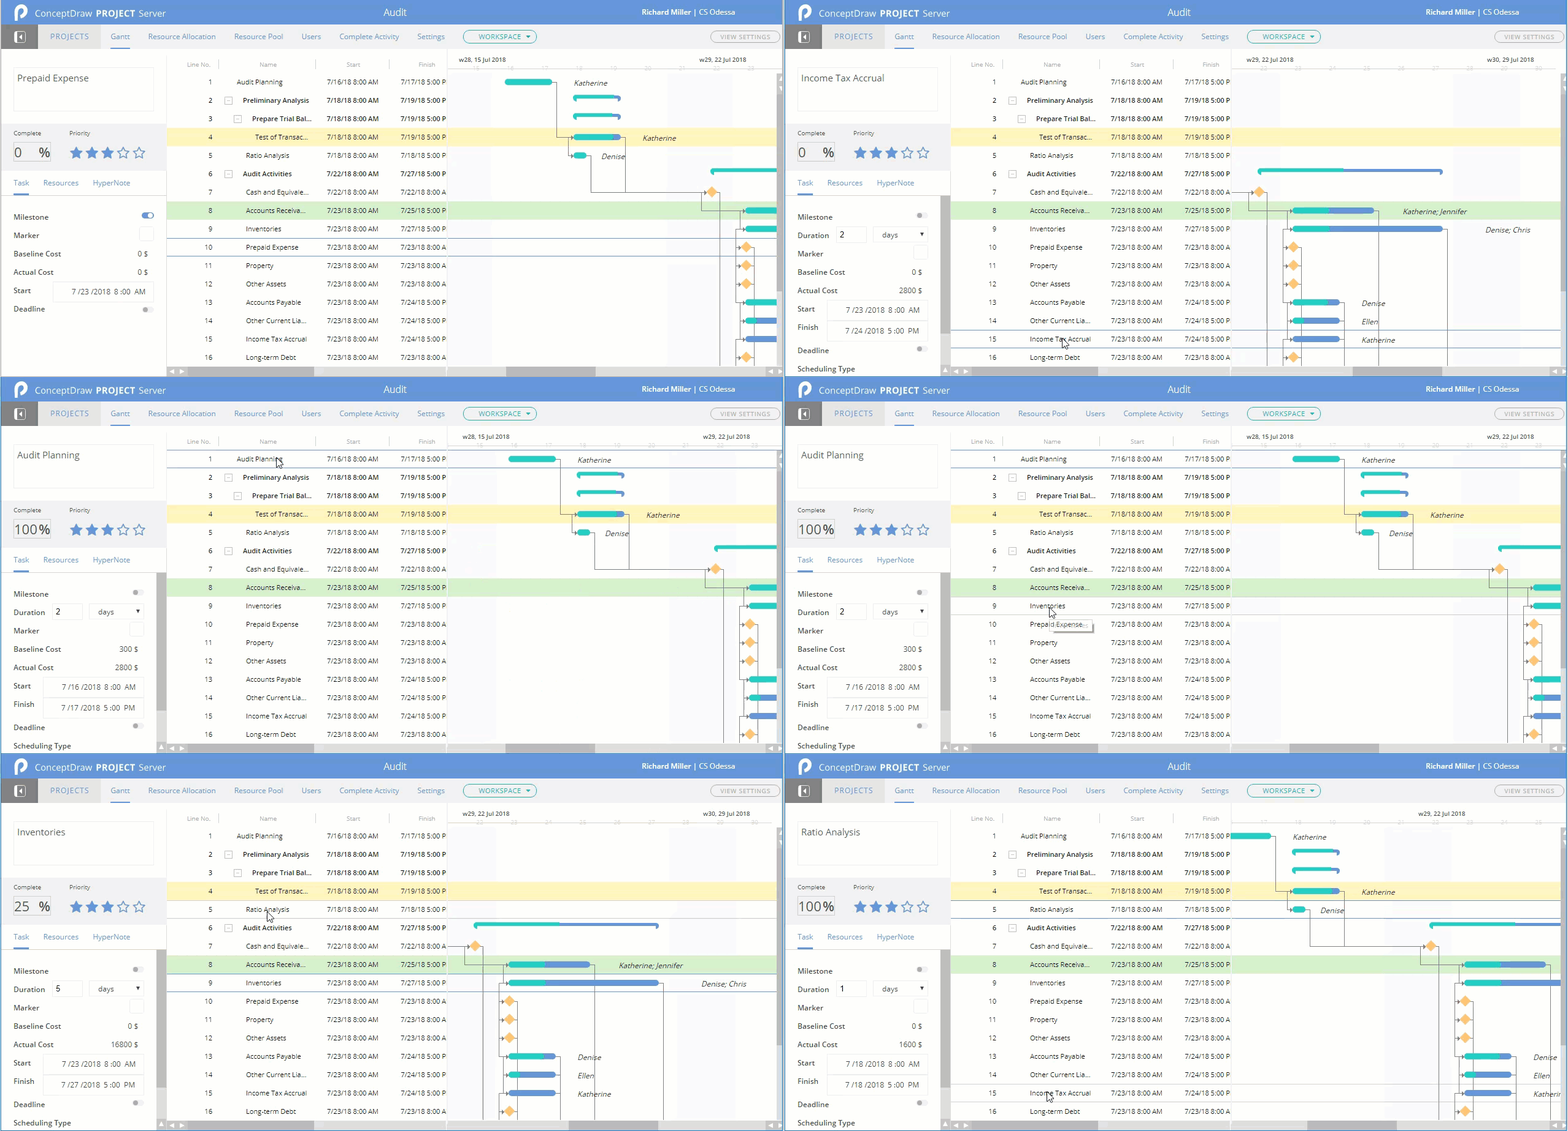
How to Add a Color Marker to Project Task on a Gantt Chart
ConceptDraw PROJECT Server allows adding color markers to scheduled project tasks. A color marker is used to show whether a task is marked for further action or identification of some kind. You can use markers if you want to select certain tasks for further viewing, filtering, formatting, or editing in the offline mode.Gantt Chart Diagram
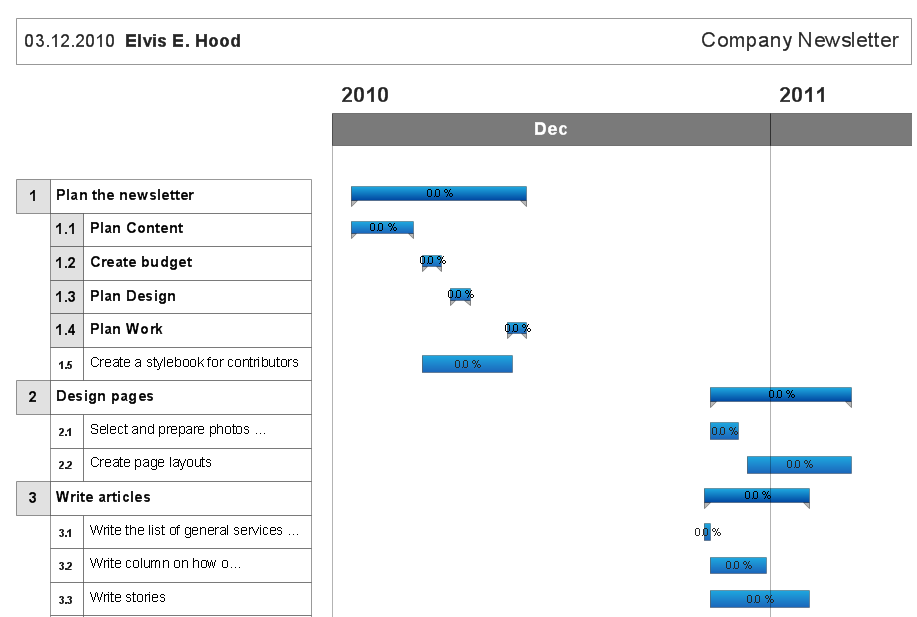
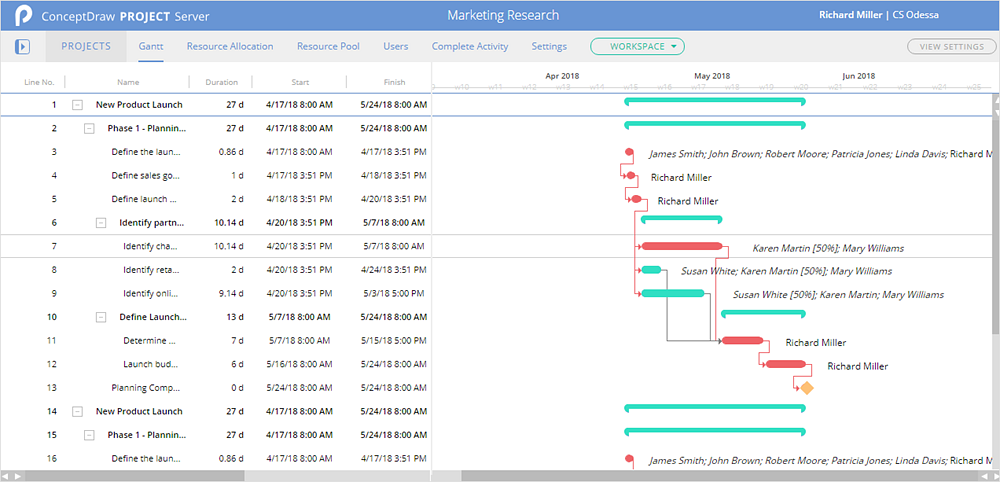
Gantt Chart is a popular type of bar charts and widely used projects planning method. It helps to illustrate the plan for some project, the progress of tasks, the resources planning, the schedule of works and working time. The Gantt Chart contains a set of intervals (bars) located on the time axis and reflects the use of resources by objects. Each bar represents a separate task in the project, its length is a duration of the work. The vertical axis of the graph represents the list of tasks. Besides, the chart can contain additional data, such as the percents of complete, the total tasks, the tasks dependencies, the key points (milestones), etc. The use of Gantt Chart greatly simplifies the project management and enables to visualize in visual and compressed view the most important information of the project, what resources are used for execution the certain tasks and which must to be the speed of their execution. ConceptDraw Office suite applications help to cope perfectly the project management tasks, to construct easily the basic structure of your project and create a Gantt Chart Diagram. PM Easy solution allows you to plan and execute the projects using the mind mapping technique, to implement planning using mind mapping, and track tasks using ConceptDraw Project.Project — Working With Costs
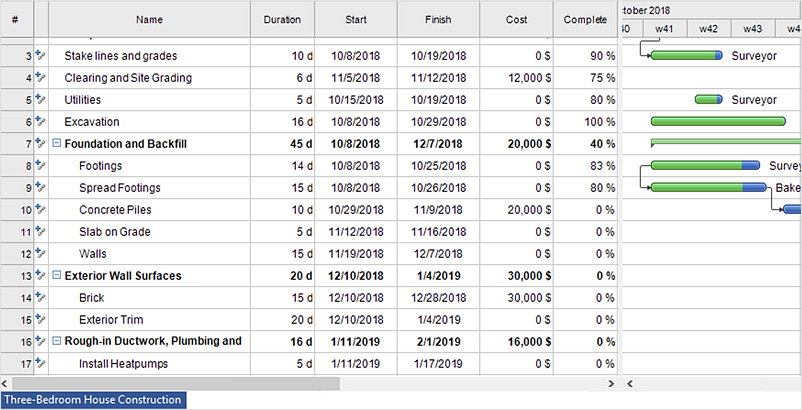
ConceptDraw PROJECT delivers a rich set of built-in functionalities and optional product extensions that support your daily workflow in time-saving and creative ways. This video lesson will teach you how to work with costs in your project document.HelpDesk
How to Import Project Data From MS Excel File
You can import information into the project from MS Excel workbook using the entered fields - fields in which you can enter or edit information as opposed to calculated fields.HelpDesk
How to Generate Tabular Reports in ConceptDraw PROJECT for macOS
Project reporting is one of the key functions of effective project management. Using regular project reports, project manager can constantly track and analyze the project’s execution. This analytic process can help to ensure that the team reaches the best possible solutions. ConceptDraw PROJECT is a professional software tool for project management with the advanced mechanism of reporting. You can create the set of regular reports on project activities, task statuses, cash flow and assignments in MS Excel format. Mind map reports are also available.How to Create Presentation of Your Project Gantt Chart
During the planning, discussing and execution of a project you may need to prepare a presentation using project views such as the Gantt Chart, Multiproject Dashboard or Resource Usage View. It’s easy do with ConceptDraw PROJECT!HelpDesk
How To Show Critical Path in ConceptDraw PROJECT Server
The critical path in project management means the picked tasks that influence the start and finish date of a project. Changing date of these selected tasks leads to change of the finish date for the entire project. ConceptDraw PROJECT Server offers a set of tools to track your project tasks, including the possibility to highlight the critical path. Thus you can view, how much a date shift in one task will influence on your project date.HelpDesk
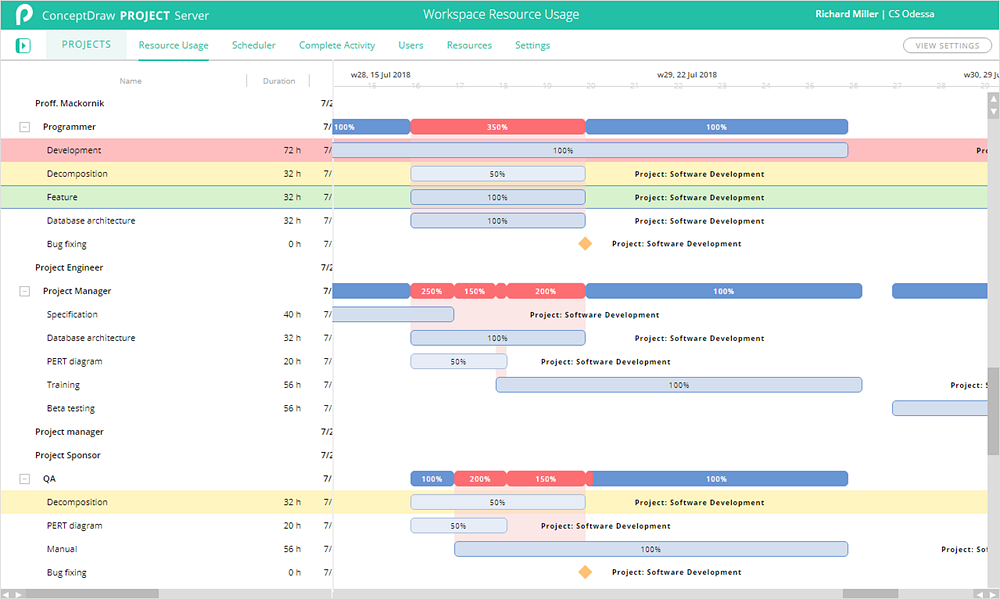
How to Monitor Resource Usage in ConceptDraw PROJECT Server
ConceptDraw PROJECT Server provides a lot of valuable features used to easier your work when managing resources allocation. ConceptDraw PROJECT Server offers easy-to-use tools for management and distribution of human resources. You can view the list of all resources assigned to all your projects or just to the current project. You can see their workload in the current project or summary load in all projects. Thus, you can effectively and rationally reallocate them if needed.- Gantt Chart Template Excel
- How to Input Data from MS Excel Into a Mind Map | How to Track ...
- Project — Working With Costs | How to Input Data from MS Excel ...
- How to Draw a Gantt Chart Using ConceptDraw PRO | How to ...
- What is Gantt Chart (historical reference) | How to Export Project ...
- Gantt Chart For Construction Project Pdf
- How to Create Presentation of Your Project Gantt Chart ...
- How to Make a Mind Map from a Project Gantt Chart | Basic ...
- How to Input Data from MS Excel Into a Mind Map | Software ...
- Project — Working With Costs | How to Export Project Data to MS ...
