This site uses cookies. By continuing to browse the ConceptDraw site you are agreeing to our Use of Site Cookies.
HelpDesk

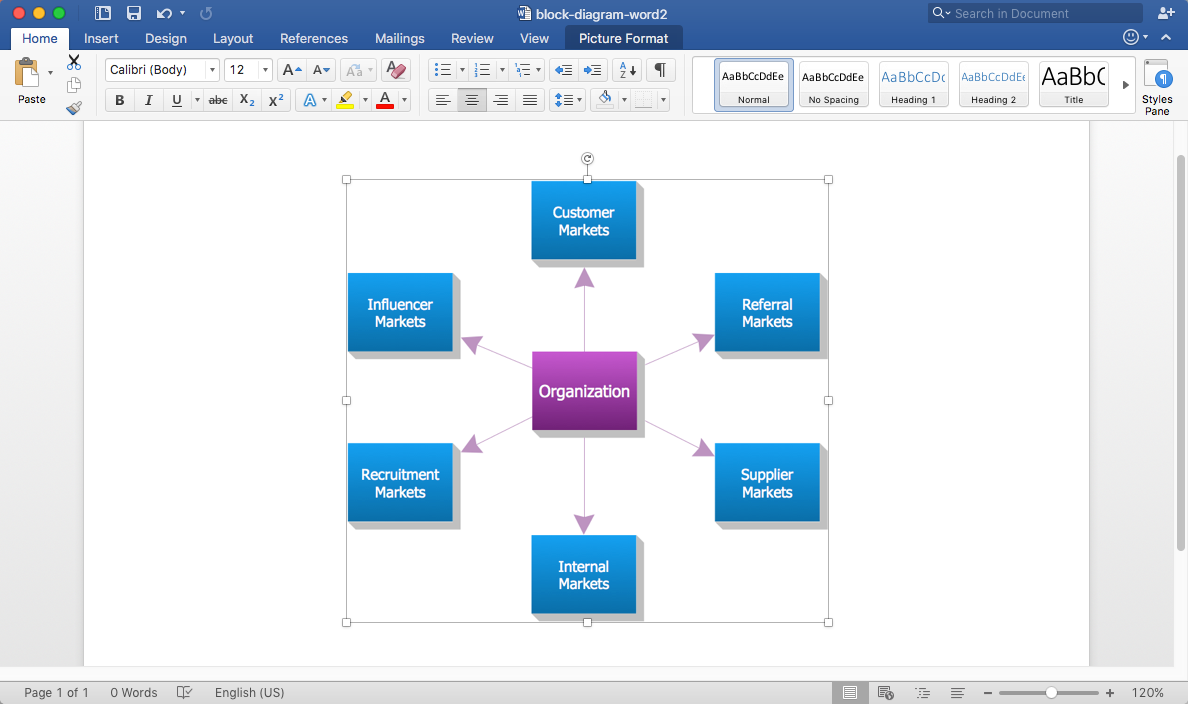
How to Add a Block Diagram to an MS Word ™ Document

Block diagram consists of graphic blocks. Blocks are connected by lines or arrows. Block diagrams are used to show the relationship between parts of some systems. It can be used for the development of new systems or to improve existing ones. The structure of the block diagram gives a high-level overview of the major components of the system, as well as the important relationships. Using the block diagrams, you can more effectively present the business data contained in your MS Word documents. ConceptDraw DIAGRAM allows you to easily create block diagrams and then insert them into an MS Word document.
HelpDesk

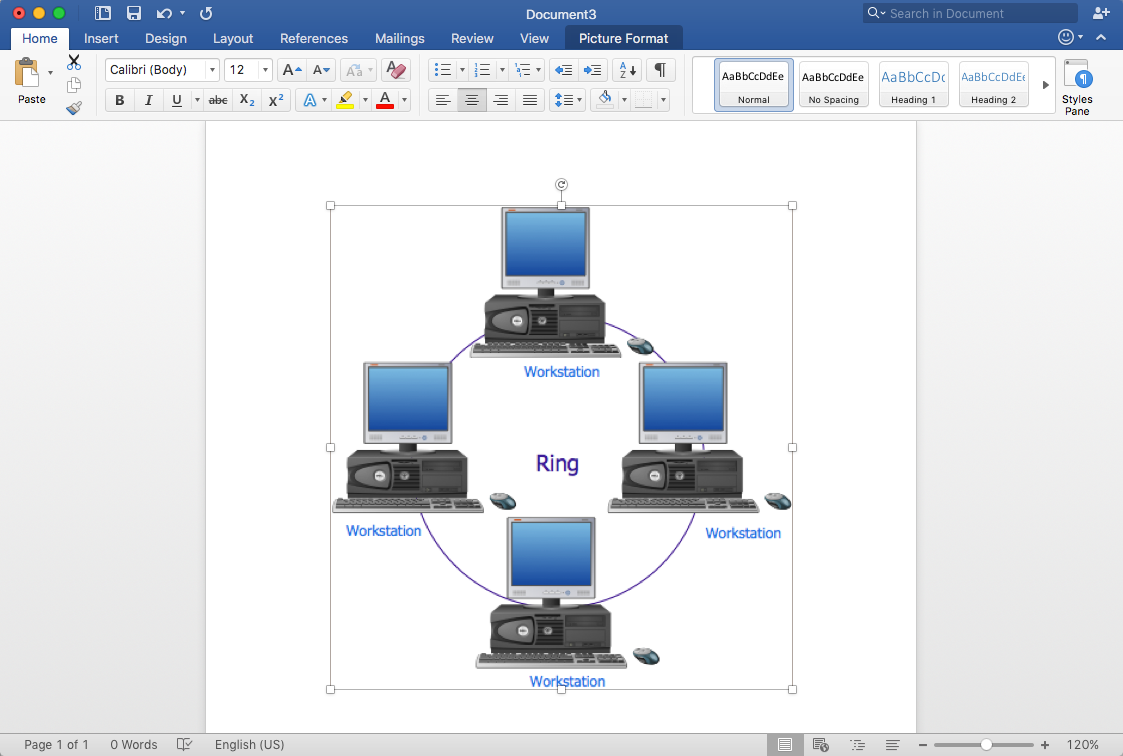
How to Add a Network Diagram to MS Word

Effective management of the computer network of any size includes the creation and maintenance of the network documentation package. Computer network diagrams may be the part of the network documentation that is often presented as MS Word document. Network diagrams describing the topology of the network and equipment installed in the network, are the essential part of this package. ConceptDraw DIAGRAM provides network administrators with the ability to easily create computer network diagrams and then insert them into an MS Word document.
HelpDesk

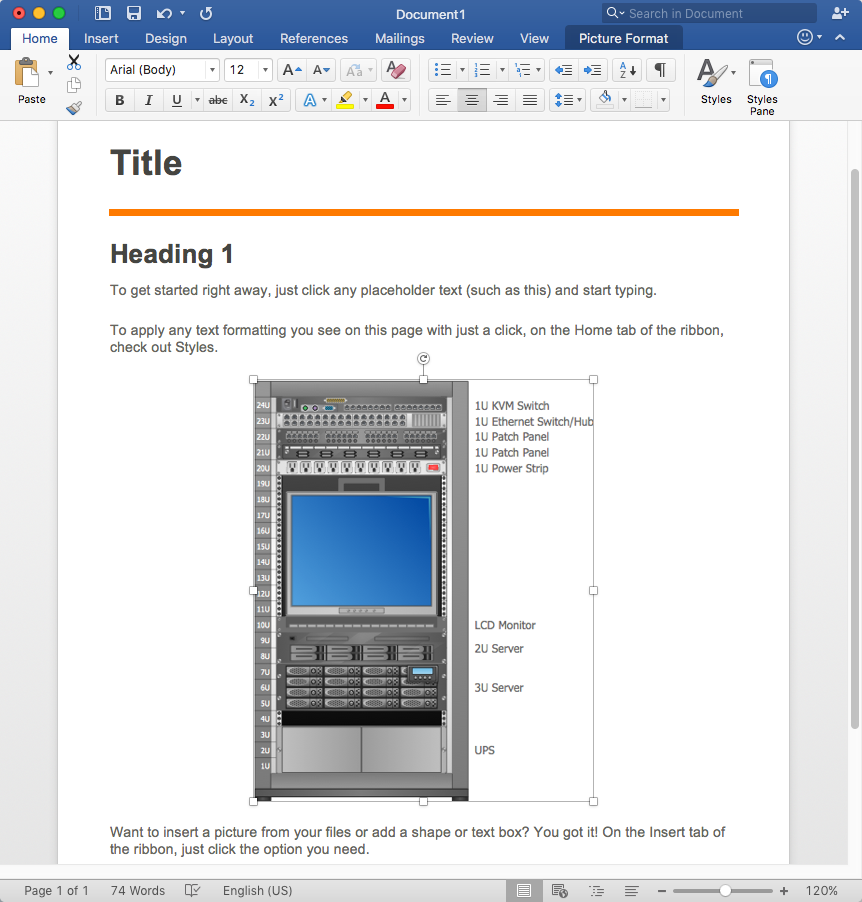
How to Add a Rack Diagram to MS Word Document

Rack Diagram depicts the structure of network equipment installation and provides the network administrator with the base to support electronic equipment, power, cooling, and cable management. ConceptDraw DIAGRAM allows you to easily create a diagram that will help to detail the type of rack equipment that best fits your needs and then lets you insert the scheme of rack configuration into the network documentation pack. ConceptDraw DIAGRAM allows you to easily create rack configuration diagrams and then insert them into an MS Word document.
HelpDesk

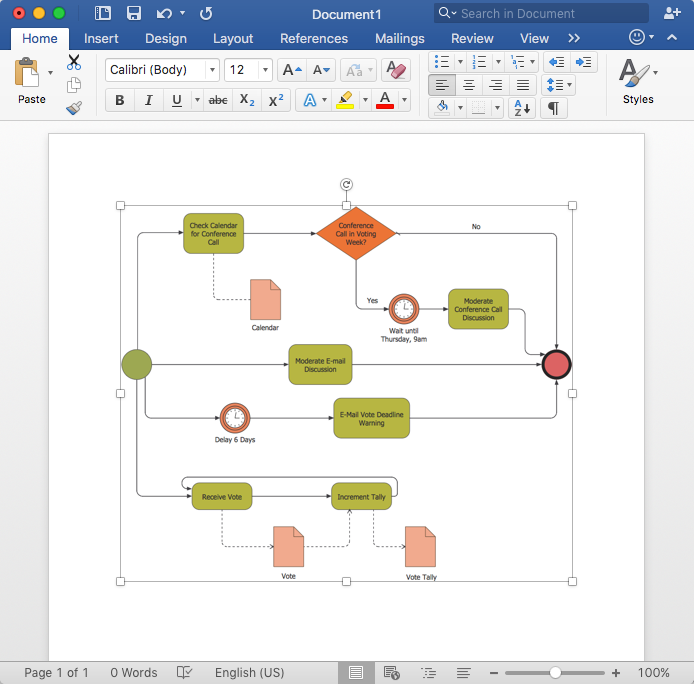
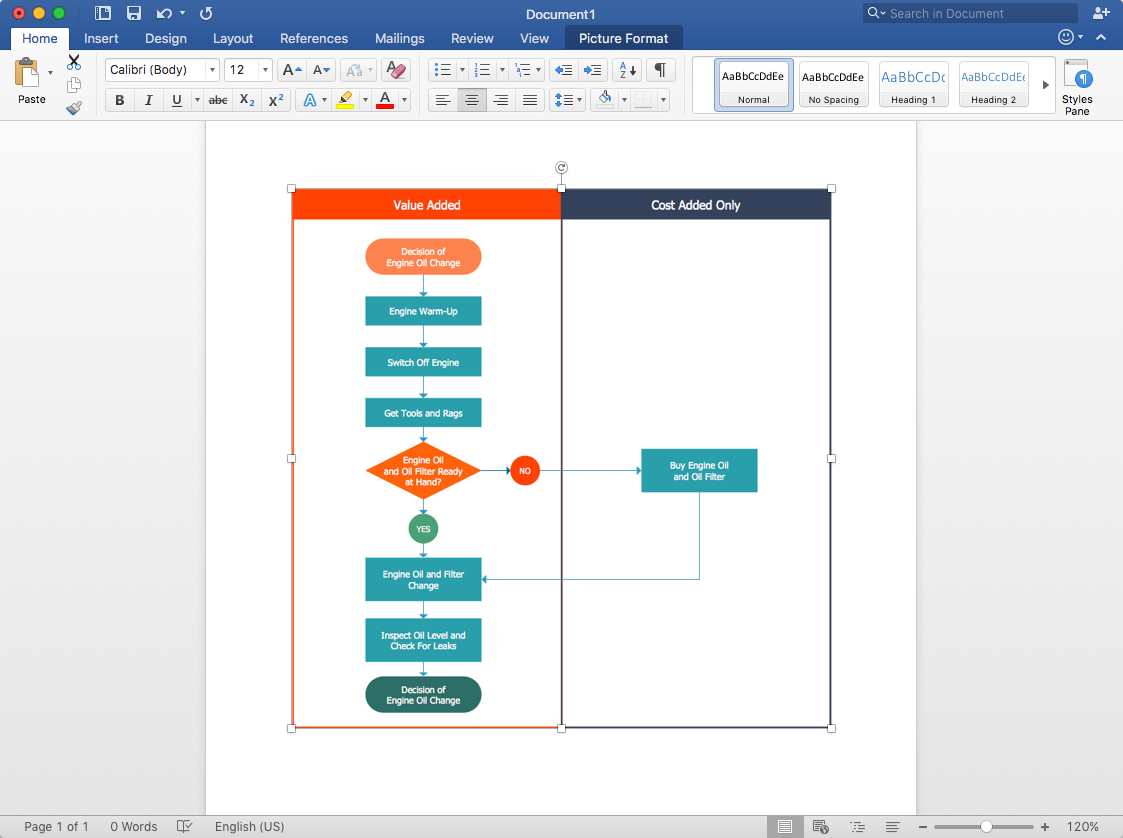
How to Add a Business Process Diagram to MS Word Document

ConceptDraw DIAGRAM allows you to easily create business process diagrams and then add them to an MS Word document.
HelpDesk

How to Add a Bubble Diagram to MS Word

A bubble diagram is used the same purpose as a scatter diagram, but in the case, if the data has three dimensions, each of that containing the set of values. A bubble chart is a diagram in which the data points are replaced with bubbles, and the size of the bubbles represents some additional dimension of the data. A bubble chart does not have the axis. The sizes of the bubbles are determined by the values in the third dimension. Any additional information about the entities beyond their three primary dimensions can be depicted by rendering bubbles in colors and patterns that are selected in a certain way. The legend containing the further information can be added to a bubble diagram. ConceptDraw DIAGRAM allows you to easily create various business management and marketing charts, including bubble diagrams and then add them to an MS Word document.
HelpDesk

How to Add a Telecommunication Network Diagram to MS Word
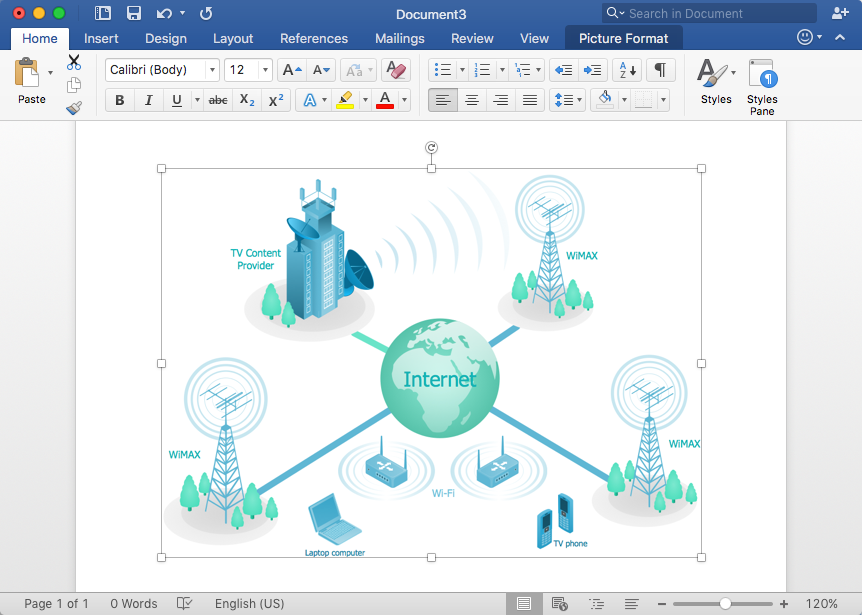
ConceptDraw DIAGRAM allows you to easily create telecom network diagrams and then insert them into an MS Word document.
HelpDesk

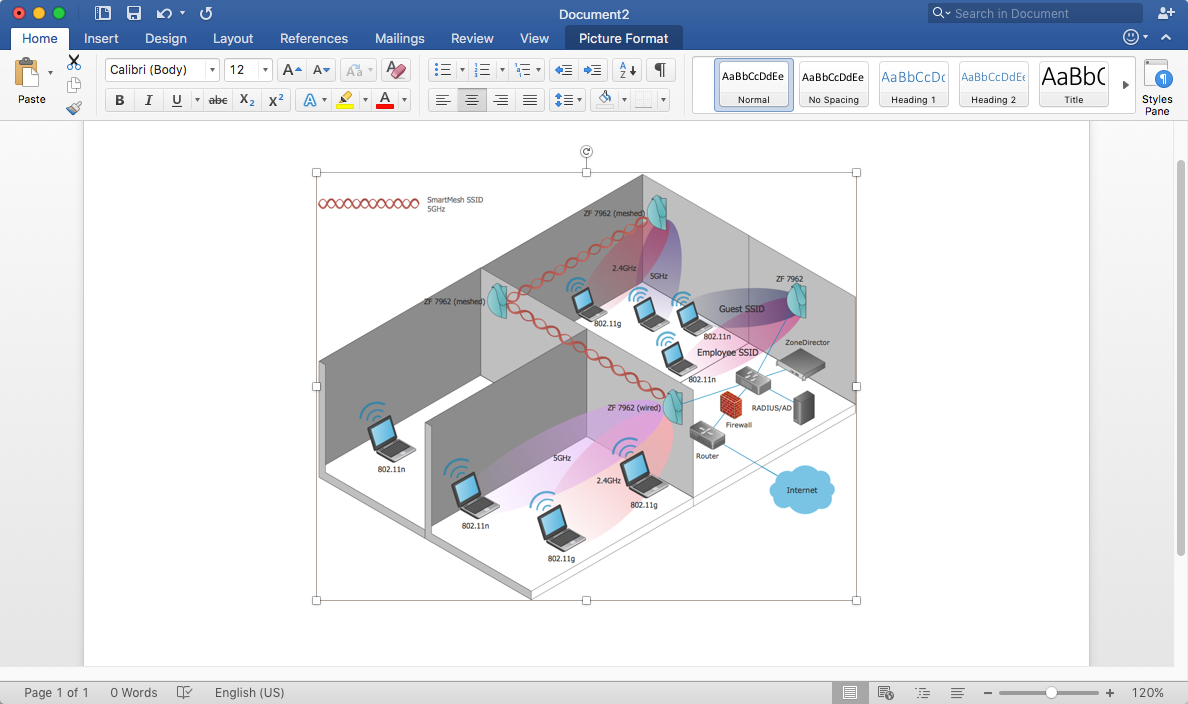
How to Add a Wireless Network Diagram to MS Word Document

ConceptDraw DIAGRAM allows you to easily create wireless computer network diagrams and then insert them into an MS Word document.
HelpDesk

How to Add a Fishbone (Ishikawa) Diagram to an MS Word Document

The ability to create a fishbone (Ishikawa) Diagram is supported by the ConceptDraw Fishbone Diagram solution. ConceptDraw DIAGRAM allows you to easily create fishbone diagrams and then insert them into an MS Word document.
HelpDesk

How to Add a Cross-Functional Flowchart to MS Word

A cross-functional flowchart is a type of flowchart that can be helpful in understanding a complicated process flow. ConceptDraw DIAGRAM allows you to easily create cross-functional flowcharts and then insert them into MS Word document.

How to Make SWOT Analysis in a Word Document

A SWOT Analysis is a popular strategic planning tool used to evaluate the Strengths, Weaknesses, Opportunities, and Threats involved in any businesses. You can export your SWOT mind map into a MS Word document, which makes using SWOT mind map easier if you need to collaborate it with other people.
ConceptDraw products across any platform, meaning you never have to worry about compatibility again. ConceptDraw MINDMAP allows you to make SWOT analysis on PC or macOS operating systems.
HelpDesk

How to Insert a Mind Map into Microsoft Word Document

ConceptDraw MINDMAP offers several options of converting your mind map to MS Word document.
You can choose the proper format that meets your needs to communicate the content of your mind maps. Generate text, presentations, images or web pages that are pertinent to your work. Primary, you can export a mind map to MS Word. This method allows stylizing the document by using a custom MS Word templates. If you need to combine text and hierarchically structured information in a single document, the best solution is to incorporate a mind map into the MS Word document using the copy-paste capabilities of ConceptDraw MINDMAP.

In searching of alternative to MS Visio for MAC and PC with ConceptDraw DIAGRAM

Many of us are acquainted with such a software product as MS Visio, which beyond any doubt, is a powerful and multifunctional tool. However, there may occur instances when this program turns incapable of meeting certain users' requirements; and then, the most optimum solution is quite difficult to find. But there is always an alternative. ConceptDraw DIAGRAM from CS Odessa Corporation has been developed to satisfy all your needs as an alternative product to Visio.

Visio for mac — ConceptDraw as an alternative to MS Visio. ConceptDraw has been developed to satisfy all your needs as a fully-functioned alternative product to MS Visio for Mac.

Venn Diagram

Venn diagrams are illustrations used in the branch of mathematics known as set theory. They show the mathematical or logical relationship between different groups of things (sets). A Venn diagram shows all the possible logical relations between the sets.

Line Chart Template for Word

This sample was created in ConceptDraw DIAGRAM diagramming and vector drawing software using the Line Graphs Solution from Graphs and Charts area of ConceptDraw Solution Park.
This sample shows the Line Chart of annual percentage change. The Line Chart allows you to clearly see the changes of data over the time.

Authority Matrix Diagram Software

You need to draw Authority Matrix Diagram quick and easy? Design it with ConceptDraw DIAGRAM!
ConceptDraw DIAGRAM extended with Seven Management and Planning Tools solution from the Management Area is the best Authority Matrix Diagram Software.