HelpDesk
How to Use the Effort-Driven Scheduling Method
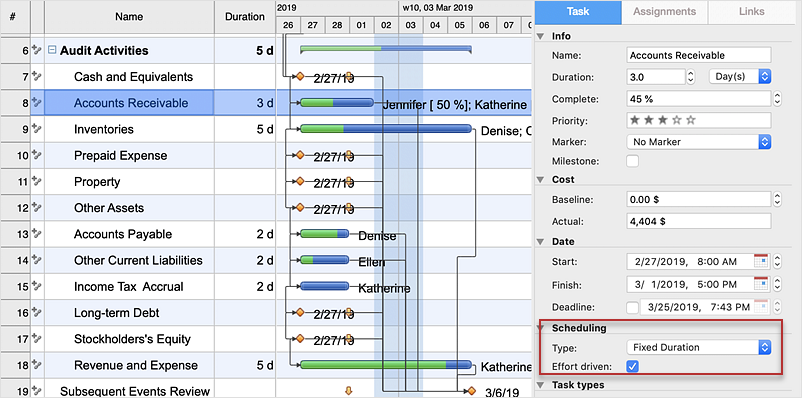
The idea of Effort-driven scheduling in project management is that each project task can be scheduled and assumed basing to the amount of the available work hours. Effort-driven scheduling is used as the default method of project scheduling in ConceptDraw PROJECT. This means that task duration, units, and work amount for individual assignment depend on the entire work, required for a given task. Whether you add or remove resources, the total work amount still the same, while the ConceptDraw PROJECT regulates the duration of task or units assigned for the given resources.How to Create Presentation of Your Project Gantt Chart
During the planning, discussing and execution of a project you may need to prepare a presentation using project views such as the Gantt Chart, Multiproject Dashboard or Resource Usage View. It’s easy do with ConceptDraw PROJECT!HelpDesk
What Information to be Displayed in the ConceptDraw PROJECT Gantt Chart View
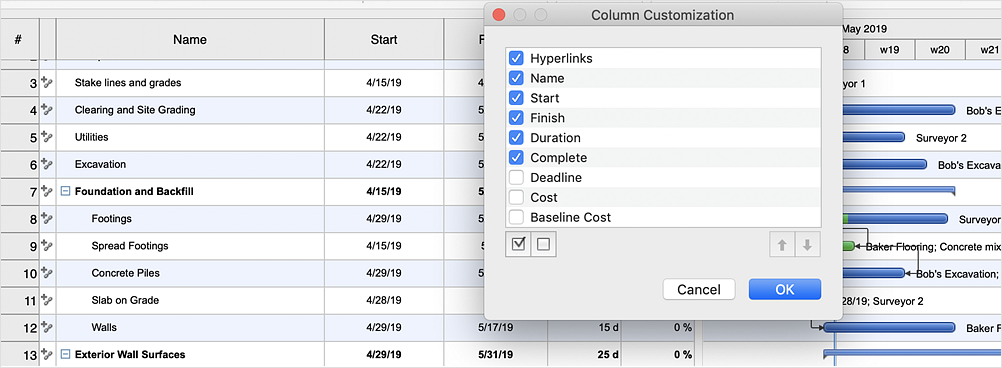
What information can contain the project task list? Gantt Chart view is a graphical representation of a project outline that allows one to allocate tasks. You can customize a project’s tasks list view to include the columns you need to meet your information requirements. The columns of the ConceptDraw PROJECT Gantt view contain the information you want to capture about each task in your project. The following article details what information can be contained in the columns of a project outline:<HelpDesk
How to Track Your Project Plan vs. the Actual Project Condition
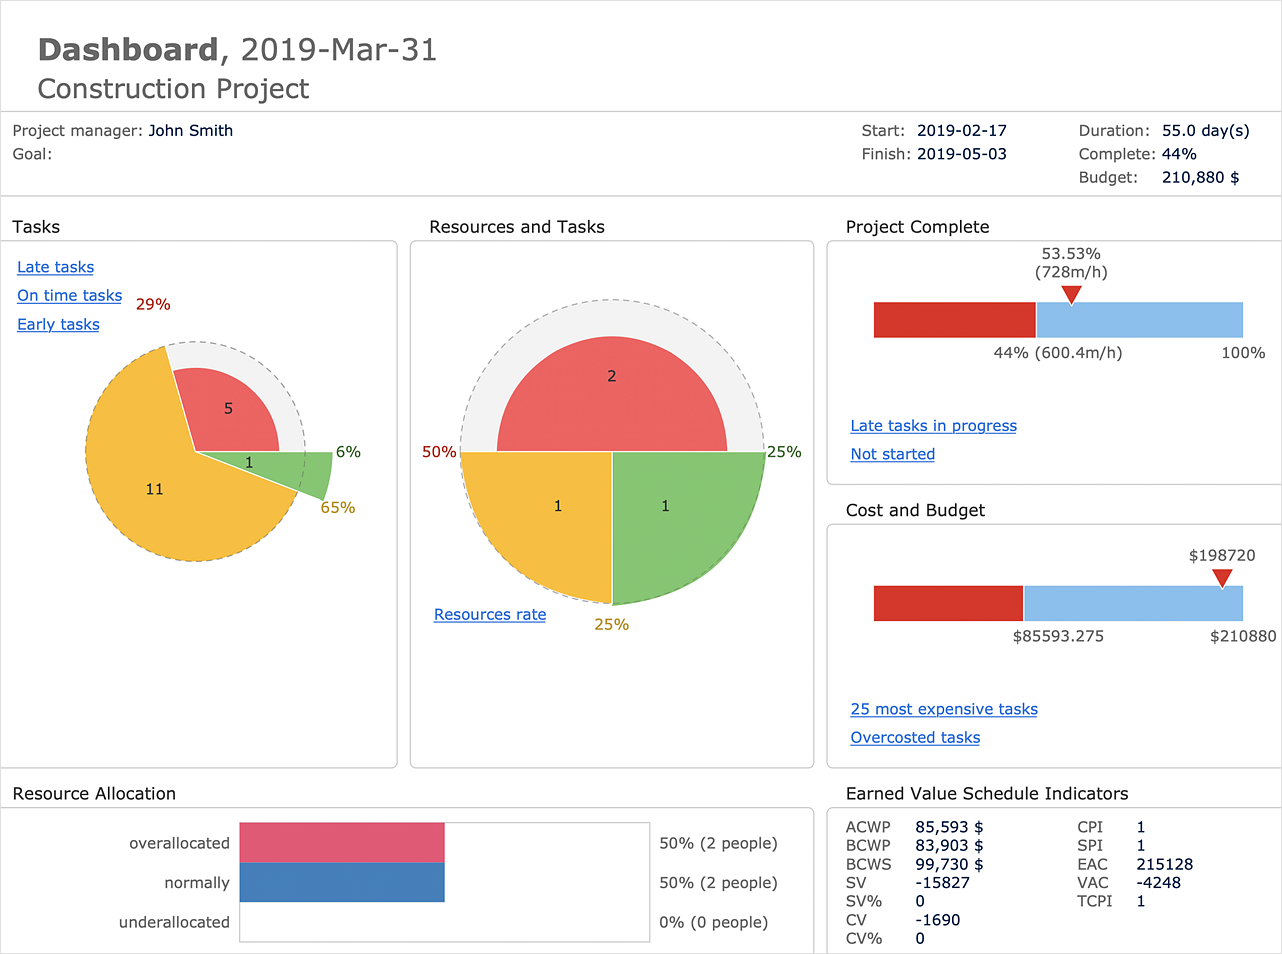
ConceptDraw PROJECT provides a user with the possibility to track how the project is going. Project Manager can compare the actual data with the planned and assess possible measures to resolve issues. ConceptDraw PROJECT has several types of visual reports that can help to assess visually the difference between planned and actual project data.HelpDesk
How to Create Multiple Projects Schedule on macOS
You can create a detailed schedule of your project quickly and easy with ConceptDraw PROJECT. It is easy to use the Multiproject Dashboard to plan multiple projects as if were a single one.HelpDesk
How to Customize Columns in Your Project Schedule
Some ConceptDraw PROJECT users need to start new projects from their custom default page. In this post we tell you how to make it.HelpDesk
How to Plan Projects Effectively Using Solutions
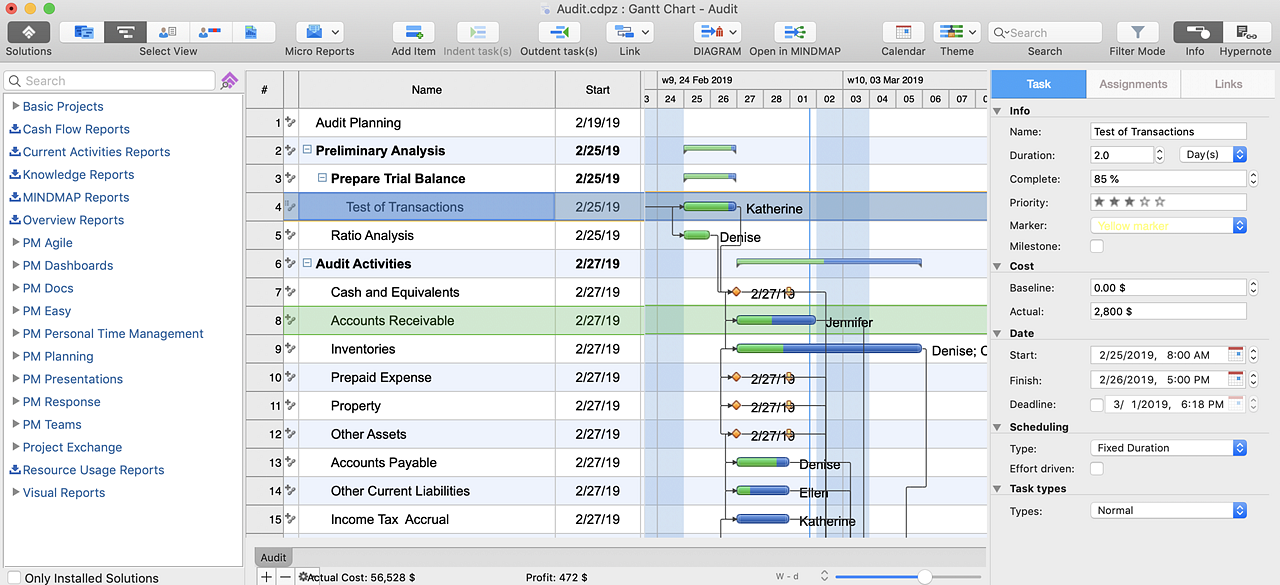
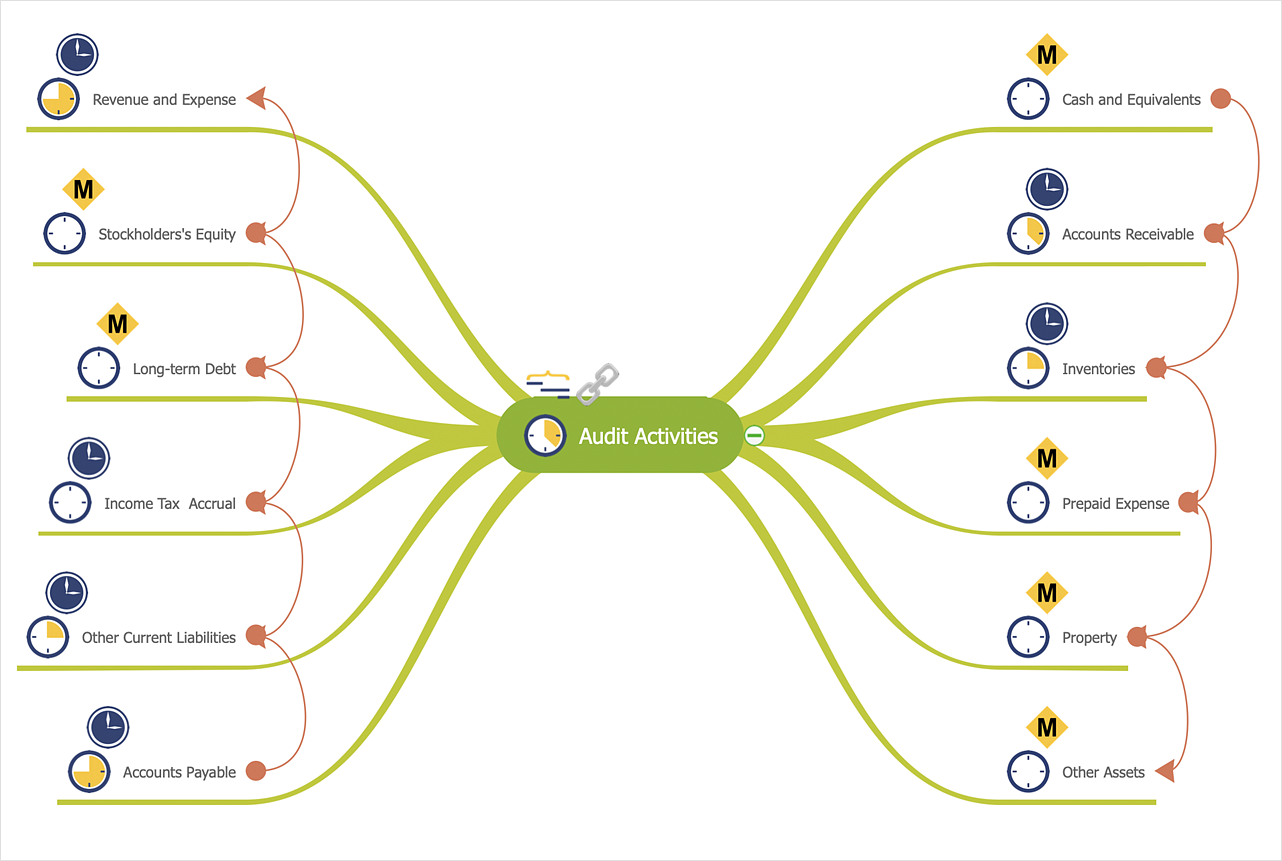
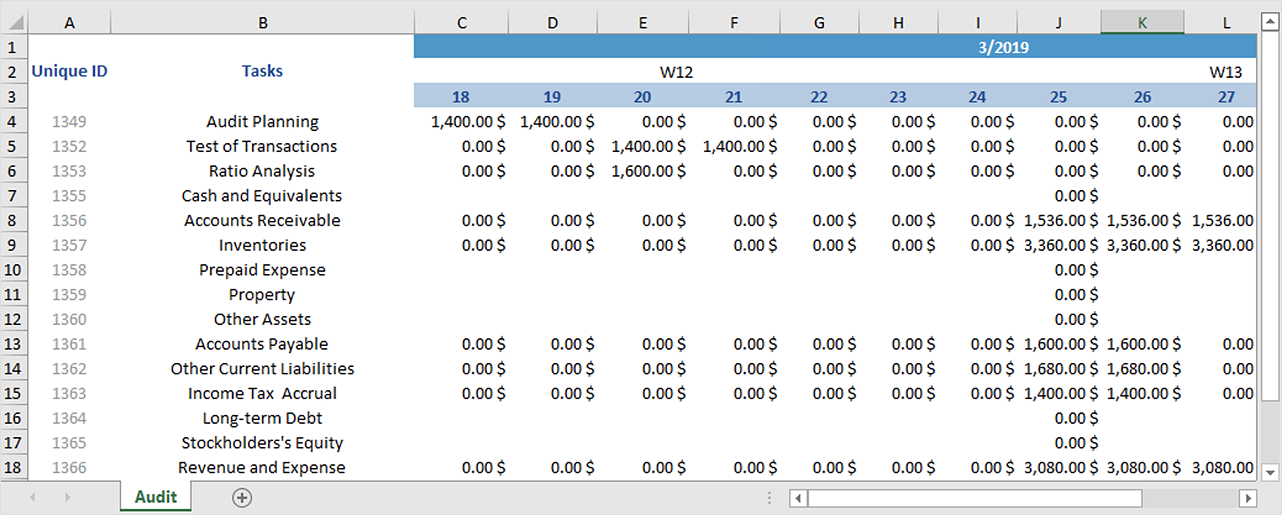
You can turn a project mind map into a Gantt chart. The advanced data exchange capabilities of ConceptDraw MINDMAP and ConceptDraw PROJECT allows you to view your mind map as a Gantt chart. This way you are switching between views of the same file.HelpDesk
How to Create a Mind Map from Selected Tasks in Project
You can see the project data in a mind map structure by create a mind map from the selected project tasks.HelpDesk
