This site uses cookies. By continuing to browse the ConceptDraw site you are agreeing to our Use of Site Cookies.

Technical Drawing Software

Technical Drawing Software for drawing technical diagram, electrical and technical drawing. Download Drawing Software ConcepDraw for Free.
ConceptDraw DIAGRAM extended with: Mechanical Engineering Solution, Electrical Engineering Solution, Chemical and Process Engineering Solution from the Industrial Engineering Area is powerful software for business and technical drawing. Its powerful drawing tools, predesigned vector objects, templates, samples are helpful for creation all kinds of Technical Drawings and Technical Diagrams, Electrical and Mechanical Schematics, Circuit and Wiring Diagrams, Structural Drawings, and many other.

Technical Drawing Software

Science and technology rapidly develop in the modern world. Electronic devices, computers and various software are very popular now. The technical drawing software is already necessity today. ConceptDraw DIAGRAM is new software for business and technical drawing. It offers a powerful tools for all kinds of technical drawing with pre-drawn shapes, free samples of business drawings and flowcharts, support for many graphic formats enables users to visually develop their technical drawings charts, schematics and diagrams in any combination of drawings, diagrams and flow charts.
HelpDesk

How to Create a Mechanical Diagram

Mechanical Engineering drawing is a type of technical drawing that helps analyze complex engineering systems. Mechanical Engineering diagrams are often a set of detailed drawings used for engineering or construction projects.
Making Mechanical Engineering diagram involves many different elements that can be managed using ConceptDraw DIAGRAM. You can design elements for drawing parts, assembly, pneumatic, and hydraulic systems for mechanical engineering. With ConceptDraw DIAGRAM you can easily create and communicate the Mechanical Engineering diagram of any complexity.
HelpDesk

How to Draw Physics Diagrams

Physics charts can be helpful when you learn Physics, perform experiments, or solve any other tasks regarding Physics. ConceptDraw DIAGRAM allows you to draw physical diagrams of mechanical, nuclear, optical and electrical processes using the set of vector physics symbols and physics diagram templates. Nothing is more helpful in the study of physics as a visual representation of the physical processes: physics schemes, diagrams, and illustrations.
HelpDesk

How to Draw an Electrical Scheme Using Electrical Engineering Solution

The circuit diagram shows the scheme of a location of components and connections of the electrical circuit using a set of standard symbols. It can be used for graphical documentation of electrical circuit components. There are many different electric circuit symbols that can be used in a circuit diagram. Knowing how to read circuit diagrams is a useful skill not only for professionals but for any person who can start creating his own small home electronic projects. The ability to visualize industrial systems in electronics, electrical, chemical, process, and mechanical engineering is delivered by the ConceptDraw Electrical Engineering solution.
HelpDesk

How to Create an Electrical Diagram

There are many different electric circuit symbols that can be used in a circuit diagram. Knowing how to read circuit diagrams is a useful skill not only for professionals but for any person who can start creating his own small home electronic projects. The circuit diagram shows the scheme of a location of components and connections of the electrical circuit using a set of standard symbols. It can be used for graphical documentation of electrical circuit components.
The ability to create electrical diagrams and schematic using ConceptDraw DIAGRAM is delivered by the Electrical Engineering solution. The solution supplied with samples, templates, and libraries of design elements for drawing electrical schematics, digital and analog logic, circuit and wiring schematics and diagrams, power systems diagrams, maintenance and repair diagrams for electronics and electrical engineering.

mechanical engineering, mechanical design software, mechanical drawing symbols, mechanical drawing software Mechanical Engineering

mechanical engineering, mechanical design software, mechanical drawing symbols, mechanical drawing software
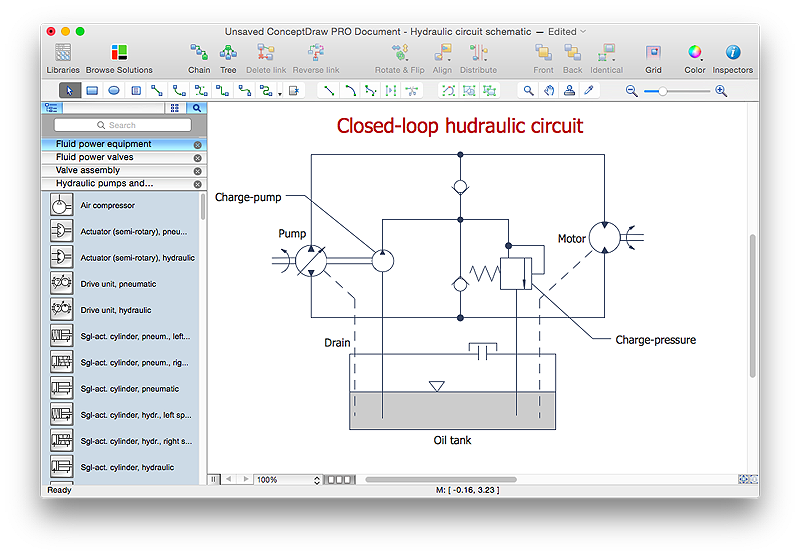
This solution extends ConceptDraw DIAGRAM.9 mechanical drawing software (or later) with samples of mechanical drawing symbols, templates and libraries of design elements, for help when drafting mechanical engineering drawings, or parts, assembly, pneumatic,

ConceptDraw Solution Park ConceptDraw Solution Park

ConceptDraw Solution Park
ConceptDraw Solution Park collects graphic extensions, examples and learning materials
HelpDesk

How to Draw a Chemical Process Flow Diagram

Process Flow Diagram widely used in modeling of processes in the chemical industry. A Chemical Process Flow diagram (PFD) is a specialized type of flowchart. With the help of Chemical Process Flow Diagram, engineers can easily specify the general scheme of the processes and chemical plant equipment. Chemical Process Flow Diagram displays the real scheme of the chemical process, the relationship between the equipment and the technical characteristics of the process. Chemical Process Flow Diagram illustrates the connections between the basic equipment as well as the overall structure of pipelines and other supporting equipment. The purpose of the PFD is to build the image of the basic idea of ​the chemical process. ConceptDraw DIAGRAM together with its Chemical and Process Engineering solution delivers the possibility to design Chemical Process Flow diagrams. It is designed for chemical industry engineers and designers.

draw bar chart, draw bar graph, draw column chart Bar Graphs

draw bar chart, draw bar graph, draw column chart
The Bar Graphs solution enhances ConceptDraw DIAGRAM functionality with templates, numerous professional-looking samples, and a library of vector stencils for drawing different types of Bar Graphs, such as Simple Bar Graph, Double Bar Graph, Divided Bar Graph, Horizontal Bar Graph, Vertical Bar Graph, and Column Bar Chart.

audit flowchart, fiscal flowchart, audit steps, chart audits, chart auditor, auditing process, audit process flowchart, audit planning process Audit Flowcharts

audit flowchart, fiscal flowchart, audit steps, chart audits, chart auditor, auditing process, audit process flowchart, audit planning process
Audit flowcharts solution extends ConceptDraw DIAGRAM software with templates, samples and library of vector stencils for drawing the audit and fiscal flow charts.

draw area chart, draw area graph Area Charts

draw area chart, draw area graph
Area Charts are used to display the cumulative totals over time using numbers or percentages; or to show trends over time among related attributes. The Area Chart is effective when comparing two or more quantities. Each series of data is typically represented with a different color, the use of color transparency in an object’s transparency shows overlapped areas and smaller areas hidden behind larger areas.

draw pie chart, draw donut chart Pie Charts

draw pie chart, draw donut chart
Pie Charts are extensively used in statistics and business for explaining data and work results, in mass media for comparison (i.e. to visualize the percentage for the parts of one total), and in many other fields. The Pie Charts solution for ConceptDraw DIAGRAM offers powerful drawing tools, varied templates, samples, and a library of vector stencils for simple construction and design of Pie Charts, Donut Chart, and Pie Graph Worksheets.

accounting flowchart, accounting cycle, what is the accounting cycle, accounts payable process flow chart, accounts payable flowchart, steps of accounting cycle, accounting flowchart Accounting Flowcharts

accounting flowchart, accounting cycle, what is the accounting cycle, accounts payable process flow chart, accounts payable flowchart, steps of accounting cycle, accounting flowchart
Accounting Flowcharts solution extends ConceptDraw DIAGRAM software with templates, samples and library of vector stencils for drawing the accounting flow charts.