HelpDesk
How to Create a VSM Diagram Using ConceptDraw Value Stream Mapping Solution
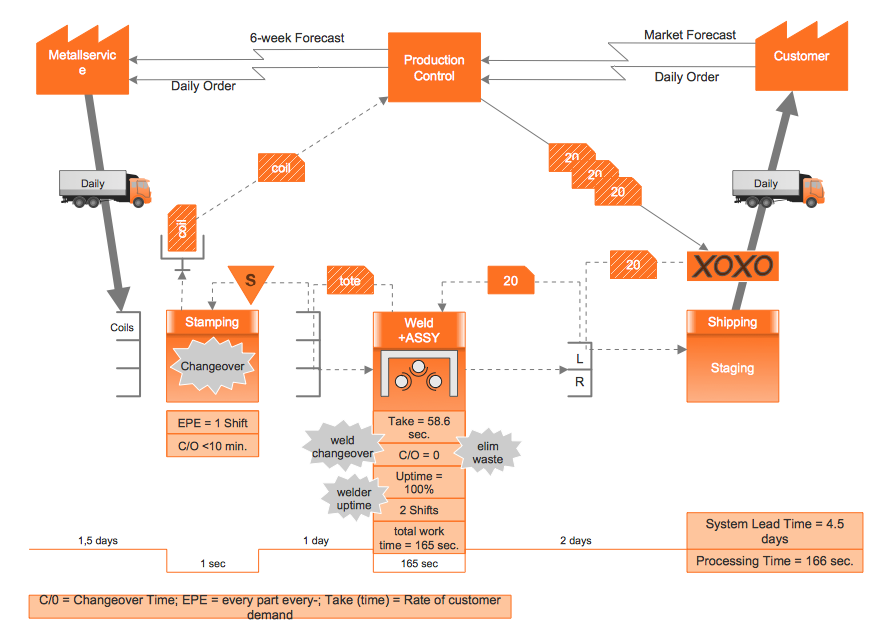
Value Stream Mapping is a Lean Manufacturing tool that uses a flow diagram to document in great detail every step of a manufacturing process. This graphical representation of a process is a powerful tool that helps in the diagnosis of process efficiency and allows companies to develop improved processes. Many lean practitioners use Value Stream Mapping as a fundamental tool to identify waste, cut process cycle times, and implement process improvement. Many organizations use value stream mapping as a key portion of their lean efforts. Value Stream Maps are used to analyze and design the flow of materials and information required to bring a product or service to a consumer. You can create a Value Stream Mapping flowchart using ConceptDraw PRO tools.HelpDesk
Event-driven Process Chain (EPC) Diagram Software
An EPC diagram is a type of flowchart used in business process analysis. It shows different business processes through various work flows. The workflows are shown as processes and events that are related to different executes and tasks that allow business workflow to be completed.An EPC diagram shows different business processes through various workflows. The workflows are seen as functions and events that are connected by different teams or people, as well as tasks that allow business processes to be executed. The best thing about this type of enterprise modelling is that creating an EPC diagram is quick and simple as long as you have the proper tool. One of the main usages of the EPC diagrams is in the modelling, analyzing and re-engineering of business processes. With the use of the flowchart, businesses are able to see inefficiencies in the processes and modify to make them more productive. Event-driven process chain diagrams are also used to configure an enterprise resource pla
 Event-driven Process Chain Diagrams
Event-driven Process Chain (EPC) Diagram is a type of flowchart widely used for modeling in business engineering and reengineering, business process improvement, and analysis. EPC method was developed within the Architecture of Integrated Information Systems (ARIS) framework.
 AWS Architecture Diagrams
The flexible AWS cloud solutions will help you to create reliable applications with a high level of scaling in the AWS cloud, to run your applications and accelerate their work on the level of security. Besides AWS resources are available worldwide and yo
 Computer and Networks Area
The solutions from Computer and Networks Area of ConceptDraw Solution Park collect samples, templates and vector stencils libraries for drawing computer and network diagrams, schemes and technical drawings.
 Value Stream Mapping
Value stream mapping solution extends ConceptDraw PRO software with templates, samples and vector stencils for drawing the Value Stream Maps (VSM) in lean manufacturing practice.
 Accounting Flowcharts
Accounting Flowcharts solution extends ConceptDraw PRO software with templates, samples and library of vector stencils for drawing the accounting flow charts.
 Cisco Network Diagrams
Cisco Network Diagrams solution extends ConceptDraw PRO software with samples, templates and libraries of vector stencils for drawing the Cisco computer network diagrams.
 Fishbone Diagrams
The Fishbone Diagrams solution extends ConceptDraw PRO v10 software with the ability to easily draw the Fishbone Diagrams (Ishikawa Diagrams) to clearly see the cause and effect analysis and also problem solving. The vector graphic diagrams produced using this solution can be used in whitepapers, presentations, datasheets, posters, and published technical material.
- How to Make a Basketball Court Diagram | Basketball | Sport Field ...
- Algorithm flowchart - Selection sorting method | Basic Flowchart ...
- Examples Of Man Type Flow Process Chart
- Flow process chart | Flow Chart for Olympic Sports | How are ...
- Application Of Man Type Flow Process Chart
- Basic Diagramming | Process Flowchart | How to Make a Basketball ...
- Picture Graphs | How to Create a Picture Graph in ConceptDraw ...
- Process Flowchart | How to Make a Basketball Court Diagram | How ...
- Basketball Court Dimensions | Basketball | Basketball Court ...
- How to Resize Objects in ConceptDraw PRO | Basketball Court ...
- Data Flow Diagram Of Basketball
- Basketball Court Diagram and Basketball Positions | Basketball ...
- Basketball Court Dimensions | Basketball Court Diagram and ...
- Basic Diagramming | Process Flowchart | Business Productivity ...
- Basketball | Basketball Plays Software | Basketball Court Diagram ...
- Basketball Court Dimensions | How to Make a Basketball Court ...
- Basketball Court Dimensions | Basketball Court Diagram and ...
- ConceptDraw Solution Park | Basketball | Matrices | Strategy ...
- Blank Flowchart
- Offensive Strategy – Spread Offense Diagram | Basketball Defense ...

