This is normal distribution graph template.
Use it to design your normal distribution graphs with ConceptDraw PRO software.
Normal (or Gaussian) distribution (bell curve) graph visualizes a continuous probability distribution that is often used as a first approximation to describe real-valued random variables that tend to cluster around a single mean value.
The marketing chart template "Normal distribution graph" is included in the Marketing Diagrams solution from the Marketing area of ConceptDraw Solution Park.
Marketing graph template
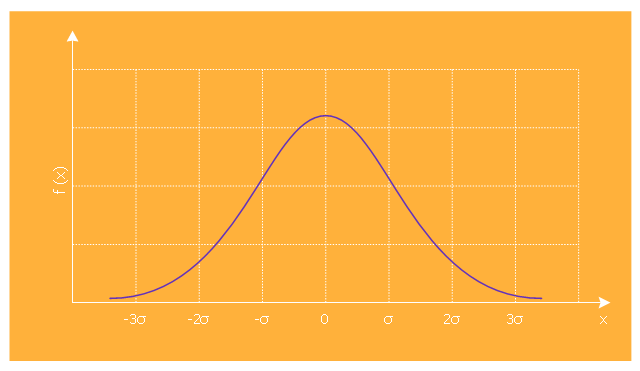
This marketing chart sample shows normal (Gaussian) distribution. It was designed on the base of the Wikimedia Commons file: Empirical Rule.PNG. [commons.wikimedia.org/ wiki/ File:Empirical_ Rule.PNG]
This file is licensed under the Creative Commons Attribution-Share Alike 4.0 International license. [creativecommons.org/ licenses/ by-sa/ 4.0/ deed.en]
"In probability theory, the normal (or Gaussian) distribution is a very commonly occurring continuous probability distribution—a function that tells the probability that an observation in some context will fall between any two real numbers. For example, the distribution of grades on a test administered to many people is normally distributed. Normal distributions are extremely important in statistics and are often used in the natural and social sciences for real-valued random variables whose distributions are not known.
The Gaussian distribution is sometimes informally called the bell curve. However, many other distributions are bell-shaped (such as Cauchy's, Student's, and logistic). The terms Gaussian function and Gaussian bell curve are also ambiguous because they sometimes refer to multiples of the normal distribution that cannot be directly interpreted in terms of probabilities." [Normal distribution. Wikipedia]
The chart example "Normal (Gaussian) distribution graph" was created using the ConceptDraw PRO diagramming and vector drawing software extended with the Marketing Diagrams solution from the Marketing area of ConceptDraw Solution Park.
Marketing chart
-distribution-graph.png--diagram-flowchart-example.png)
 Marketing Diagrams
Marketing Diagrams solution extends ConceptDraw DIAGRAM diagramming software with abundance of samples, templates and vector design elements intended for easy graphical visualization and drawing different types of Marketing diagrams and graphs, including Branding Strategies Diagram, Five Forces Model Diagram, Decision Tree Diagram, Puzzle Diagram, Step Diagram, Process Chart, Strategy Map, Funnel Diagram, Value Chain Diagram, Ladder of Customer Loyalty Diagram, Leaky Bucket Diagram, Promotional Mix Diagram, Service-Goods Continuum Diagram, Six Markets Model Diagram, Sources of Customer Satisfaction Diagram, etc. Analyze effectively the marketing activity of your company and apply the optimal marketing methods with ConceptDraw DIAGRAM software.
Competitor Analysis

 Logistics Flow Charts
Logistics Flow Charts solution extends ConceptDraw DIAGRAM functionality with opportunities of powerful logistics management software. It provides large collection of predesigned vector logistic symbols, pictograms, objects and clipart to help you design with pleasure Logistics flow chart, Logistics process flow diagram, Inventory flow chart, Warehouse flowchart, Warehouse management flow chart, Inventory control flowchart, or any other Logistics diagram. Use this solution for logistics planning, to reflect logistics activities and processes of an enterprise or firm, to depict the company's supply chains, to demonstrate the ways of enhancing the economic stability on the market, to realize logistics reforms and effective products' promotion.
Marketing Analysis Diagram

The vector stencils library "Marketing diagrams" contains 12 templates of marketing and sales diagrams and charts. Use it to illustrate your marketing and sales documents, presentations, infographics and webpages in ConceptDraw PRO software extended with Marketing Diagrams solution from Marketing area of ConceptDraw Solution Park.
Diffusion of Innovations

Normal distribution

Five forces model

Leaky bucket diagram

Funnel diagram

Relationship ladder of customer loyalty

Six markets model

Product life cycle graph

Extended product life cycle graph

Service-goods continuum diagram

Step chart block

Step diagram block

Flow chart Example. Warehouse Flowchart


Histogram Chart

- Graphs On Marketing And Distribution
- Normal distribution graph - Template | Marketing Diagrams ...
- Normal distribution graph - Template | Marketing diagrams - Vector ...
- Normal distribution graph - Template | Marketing Diagrams | Scatter ...
- Normal (Gaussian) distribution graph | Normal distribution graph ...
- Normal (Gaussian) distribution graph
- Flow chart Example. Warehouse Flowchart | Marketing Fuction Of ...
- Simple Products Marketing And Distribution Process Flow Chart
- Normal distribution graph - Template
- Normal distribution graph - Template | Double bar graph - Template ...