This marketing diagram sample illustrates leaky bucket model.
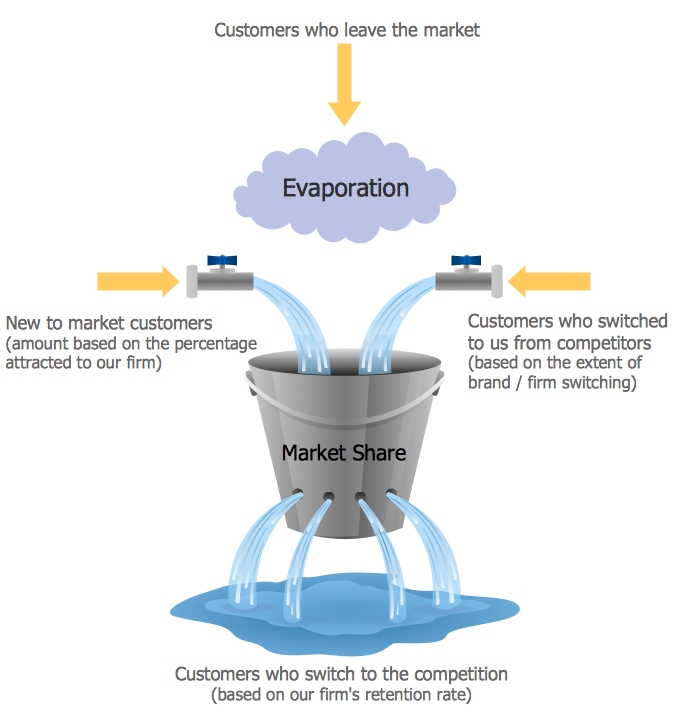
"The leaky bucket theory. The leaky bucket theory is the model that seeks to describe the process of customer gain and loss, otherwise known as customer churn. Customer retention is one of the key concepts in relationship marketing. Most companies concentrate on recruiting new customers to replace customers who move on, rather than seeking to retain customers." [Blythe J. Key Concepts in Marketing. 2009. knowledge.sagepub.com/ view/ key-concepts-in-marketing/ n5.xml]
"Customer attrition, also known as customer churn, customer turnover, or customer defection, is the loss of clients or customers.
Banks, telephone service companies, Internet service providers, pay TV companies, insurance firms, and alarm monitoring services, often use customer attrition analysis and customer attrition rates as one of their key business metrics (along with cash flow, EBITDA, etc.) because the "...cost of retaining an existing customer is far less than acquiring a new one." Companies from these sectors often have customer service branches which attempt to win back defecting clients, because recovered long-term customers can be worth much more to a company than newly recruited clients." [Customer attrition. Wikipedia]
The chart example "Leaky bucket diagram" was created using the ConceptDraw PRO diagramming and vector drawing software extended with the Marketing Diagrams solution from the Marketing area of ConceptDraw Solution Park.
Marketing chart

The vector stencils library "Marketing diagrams" contains 12 templates of marketing and sales diagrams and charts. Use it to illustrate your marketing and sales documents, presentations, infographics and webpages in ConceptDraw PRO software extended with Marketing Diagrams solution from Marketing area of ConceptDraw Solution Park.
Diffusion of Innovations

Normal distribution

Five forces model

Leaky bucket diagram

Funnel diagram

Relationship ladder of customer loyalty

Six markets model

Product life cycle graph

Extended product life cycle graph

Service-goods continuum diagram

Step chart block

Step diagram block

The vector stencils library "Marketing diagrams" contains 12 templates of marketing and sales diagrams and charts. Use it to illustrate your marketing and sales documents, presentations, infographics and webpages in ConceptDraw PRO software extended with Marketing Diagrams solution from Marketing area of ConceptDraw Solution Park.
Diffusion of Innovations
Normal distribution
Five forces model
Leaky bucket diagram
Funnel diagram
Relationship ladder of customer loyalty
Six markets model
Product life cycle graph
Extended product life cycle graph
Service-goods continuum diagram
Step chart block
Step diagram block
 Marketing Diagrams
Marketing Diagrams solution extends ConceptDraw DIAGRAM diagramming software with abundance of samples, templates and vector design elements intended for easy graphical visualization and drawing different types of Marketing diagrams and graphs, including Branding Strategies Diagram, Five Forces Model Diagram, Decision Tree Diagram, Puzzle Diagram, Step Diagram, Process Chart, Strategy Map, Funnel Diagram, Value Chain Diagram, Ladder of Customer Loyalty Diagram, Leaky Bucket Diagram, Promotional Mix Diagram, Service-Goods Continuum Diagram, Six Markets Model Diagram, Sources of Customer Satisfaction Diagram, etc. Analyze effectively the marketing activity of your company and apply the optimal marketing methods with ConceptDraw DIAGRAM software.
Market Chart
The vector stencils library "Marketing diagrams" contains 12 templates of marketing and sales diagrams and charts. Use it to illustrate your marketing and sales documents, presentations, infographics and webpages in ConceptDraw PRO software extended with Marketing Diagrams solution from Marketing area of ConceptDraw Solution Park.
Diffusion of Innovations
Normal distribution
Five forces model
Leaky bucket diagram
Funnel diagram
Relationship ladder of customer loyalty
Six markets model
Product life cycle graph
Extended product life cycle graph
Service-goods continuum diagram
Step chart block
Step diagram block
 AWS Architecture Diagrams
AWS Architecture Diagrams with powerful drawing tools and numerous predesigned Amazon icons and AWS simple icons is the best for creation the AWS Architecture Diagrams, describing the use of Amazon Web Services or Amazon Cloud Services, their application for development and implementation the systems running on the AWS infrastructure. The multifarious samples give you the good understanding of AWS platform, its structure, services, resources and features, wide opportunities, advantages and benefits from their use; solution’s templates are essential and helpful when designing, description and implementing the AWS infrastructure-based systems. Use them in technical documentation, advertising and marketing materials, in specifications, presentation slides, whitepapers, datasheets, posters, etc.
Business Diagram Software


Pyramid Diagram

- Bucket Theory Of Marketing
- Leaky bucket diagram | Marketing Diagrams | Competitor Analysis ...
- Leaky bucket diagram | Marketing Diagrams | Leaking Bucket Concept
- Leaky bucket diagram | Marketing Diagrams | Bucket Theory ...
- Leaky bucket diagram | Internet marketing - Concept map | How to ...
- Leaky bucket diagram | Marketing Diagrams | Market Chart ...
- Internet marketing - Concept map | Leaky bucket diagram | Concept ...
- Marketing Diagrams | Leaky Bucket Graphic
- Leaky bucket diagram | Marketing diagrams - Vector stencils library ...
- Service-goods continuum diagram | Marketing Diagrams | Leaky ...