Use it to create your management infogram in the ConceptDraw PRO diagramming and vector drawing software.
The example "Management indicators - Vector stencils library" is included in the solution "Marketing infographics" from the "Business infographics" area of ConceptDraw Solution Park.


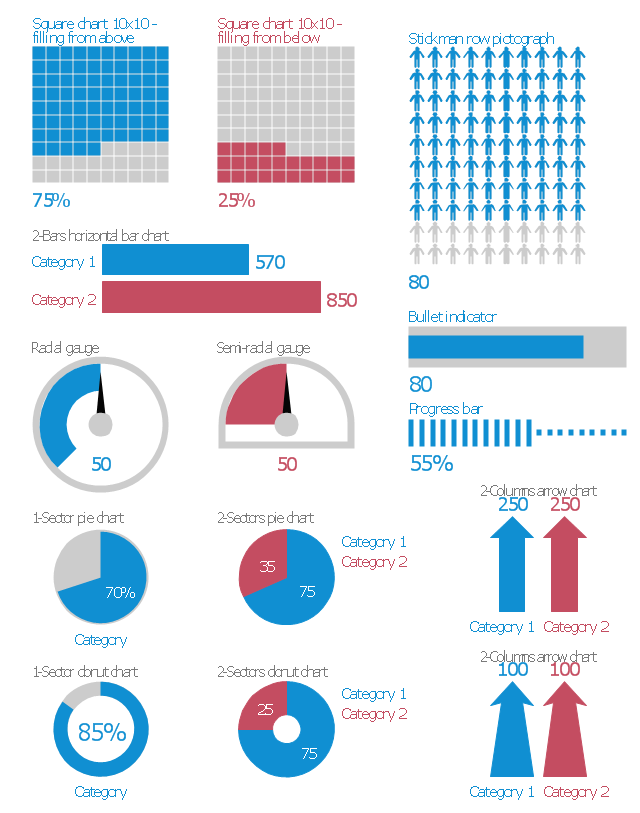
Use these visual indicators to design your management infograms.
The shapes example "Design elements - Management indicators" was created using the ConceptDraw PRO diagramming and vector drawing software extended with the Management Infographics solition from the area "Business Infographics" in ConceptDraw Solution Park.
Constant improvement of key performance indicators

Management Consultant

A management consultant is an important person for the company, he helps in the questions of improving business performance and increasing profits, he consults for the questions of business strategy, management and financial controls, resources, and also suggests recommendations for changing the structure of the company if needed.
So, every day management consultant conduct the complex work and often use the helpful management infographics for explain his thoughts and arguments to the company direction. Thanks to the development of computer technologies, drawing of management infographics is so easy today. ConceptDraw PRO diagramming and vector drawing software offers you the Management Infographics Solution from the Business Infographics Area.
Daily Infographic

Performance Indicators

The Live Objects designed to display actual measures of performance metrics and KPIs from external data source files.
Some of them also display comparative measures, and colored zones of qualitative ranges with legend.
Use it to draw business performance dashboards using the ConceptDraw PRO diagramming and vector drawing software .
"Digital dashboards may be laid out to track the flows inherent in the business processes that they monitor. Graphically, users may see the high-level processes and then drill down into low level data. This level of detail is often buried deep within the corporate enterprise and otherwise unavailable to the senior executives. ...
Specialized dashboards may track all corporate functions. Examples include human resources, recruiting, sales, operations, security, information technology, project management, customer relationship management and many more departmental dashboards. ...
Like a car's dashboard (or control panel), a software dashboard provides decision makers with the input necessary to "drive" the business. Thus, a graphical user interface may be designed to display summaries, graphics (e.g., bar charts, pie charts, bullet graphs, "sparklines," etc.), and gauges (with colors similar to traffic lights) in a portal-like framework to highlight important information. ...
Digital dashboards allow managers to monitor the contribution of the various departments in their organization. To gauge exactly how well an organization is performing overall, digital dashboards allow you to capture and report specific data points from each department within the organization, thus providing a "snapshot" of performance." [Dashboard (management information systems). Wikipedia]
The example "Design elements - Meter indicators" is included in the Meter Dashboard solution from the area "What is a Dashboard" of ConceptDraw Solution Park.

Basic Flowchart Symbols and Meaning


 Resource Usage Reports
- Management indicators - Vector stencils library | Gauges Chart ...
- Management indicators - Vector stencils library
- Design elements - Management indicators
- Management indicators - Vector stencils library | Education ...
- Management indicators - Vector stencils library | Design elements ...
- Sales dashboard - Vector stencils library | Management indicators ...
- Design elements - Meter indicators | Management indicators - Vector ...
- Design elements - Meter indicators | Sales Dashboard - Access ...
- Management indicators - Vector stencils library | Sales performance ...
- Design elements - Marketing pictograms | Management indicators ...