 Seven Management and Planning Tools
Seven Management and Planning Tools solution extends ConceptDraw PRO and ConceptDraw MINDMAP with features, templates, samples and libraries of vector stencils for drawing management mind maps and diagrams.
 Entity-Relationship Diagram (ERD)
Entity-Relationship Diagram (ERD) solution extends ConceptDraw PRO software with templates, samples and libraries of vector stencils from drawing the ER-diagrams by Chen's and crow’s foot notations.
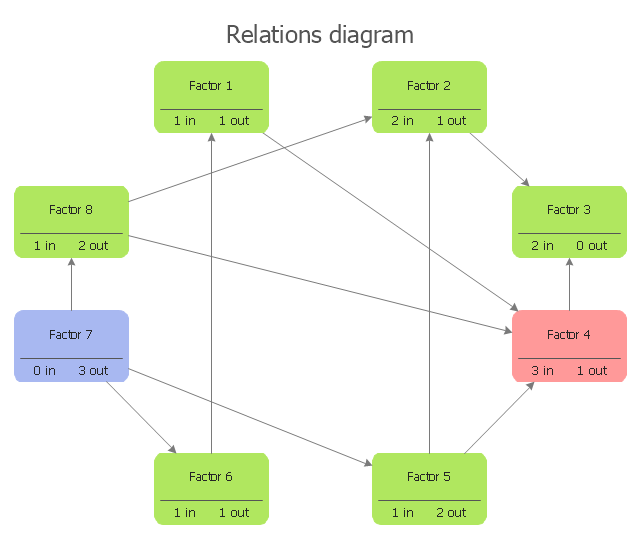
"Interrelationship digraph is a method to identify relationships among a set of items. Items that have a cause or effect associated on another item are linked together (and given weight) for the purpose of identifying the items most affected or items affecting other items the most, giving emphasis on those items for risk mitigation planning. Items involved in risk management could be risks being mitigated, risk strategies, project activities or resources. ...
This method fosters broad thinking of individuals to identify interrelationships of risk items that affect the whole project, determining critical risk areas that must be dealt first and ensures efficient allocation of project resources." [sce.uhcl.edu/ helm/ Risk_ Man_ WEB/ Planning%20 Worksheet%20 Notes_ files%5Cintrldgm.htm]
Relation diagram (interrelationship digraph, relationships digram) helps identify what factors are causes and which factors are effects. Factors help establish KPI (Key Performance Indicators) to monitor changes and the effectiveness of corrective actions in resolving a problem.
The relations diagram is one of the Seven Management and Planning Tools (7 MP tools, Seven New Quality Tools).
The relations diagram template for the ConceptDraw PRO diagramming and vector drawing software is included in the solution "Seven Management and Planning Tools" from the Management area of ConceptDraw Solution Park.
www.conceptdraw.com/ solution-park/ management-seven-mp-tools
Interrelationship digraph template
UML Diagram for System

- Fishbone Diagram | Total Quality Management TQM Diagrams ...
- Seven Management and Planning Tools | Bubble diagrams in ...
- Constant improvement of key performance indicators | TQM Diagram ...
- Marketing Diagrams | Marketing | Marketing Analysis Diagram |
- Relations diagram template | Constant improvement of key ...
- Relationships Analysis | PROBLEM ANALYSIS Relations Diagram ...
- ConceptDraw Arrows10 Technology | Best Diagramming Software ...
- ConceptDraw Solution Park | Illustration Area | Business and Finance |
- Design Element: Rack Diagram for Network Diagrams | Universal ...
- Block diagram - Personal planning process | Create Block Diagram ...
- Venn diagram - Relationship marketing | Ladder of customer loyalty ...
- Network Diagram Software LAN Diagrams | Network Diagram ...
- Network Diagram Software LAN Diagrams | Network Architecture ...
- Block diagram - Personal planning process | Basic Diagramming ...
- UML Class Diagram Example - Social Networking Site | UML Use ...
- Cross-Functional Flowcharts | Flow Chart Diagram Examples ...
- Business Process Diagram | Fishbone Diagram | Business Process ...
- Basic Diagramming | SSADM Diagram | Yourdon and Coad Diagram |
- Entity-Relationship Diagram (ERD) | Event-driven Process Chain ...
- EPC for Configuring an Enterprise Resource Planning | Modelling ...