HelpDesk
How to Draw a Pyramid Diagram

HelpDesk
How to Diagram Sentences

HelpDesk
How to Draw a Chemical Process Flow Diagram

Bubble diagrams in Landscape Design with ConceptDraw DIAGRAM

HelpDesk
How to Create a Hook-Up Diagram

HelpDesk
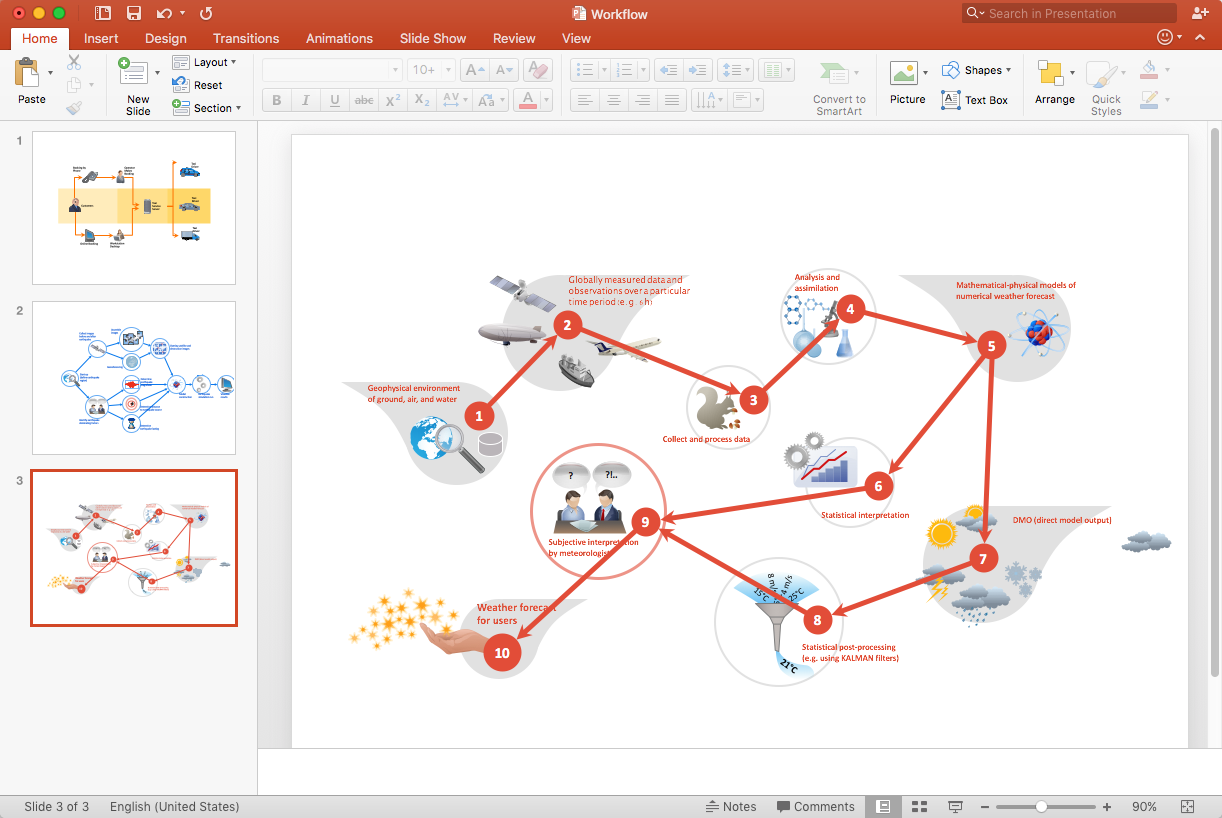
How to Add a Workflow Diagram to a PowerPoint Presentation
HelpDesk
How to Create a Rack Diagram

HelpDesk
How to Create a Mechanical Diagram
HelpDesk
How to Create an IDEF0 Diagram for an Application Development

HelpDesk
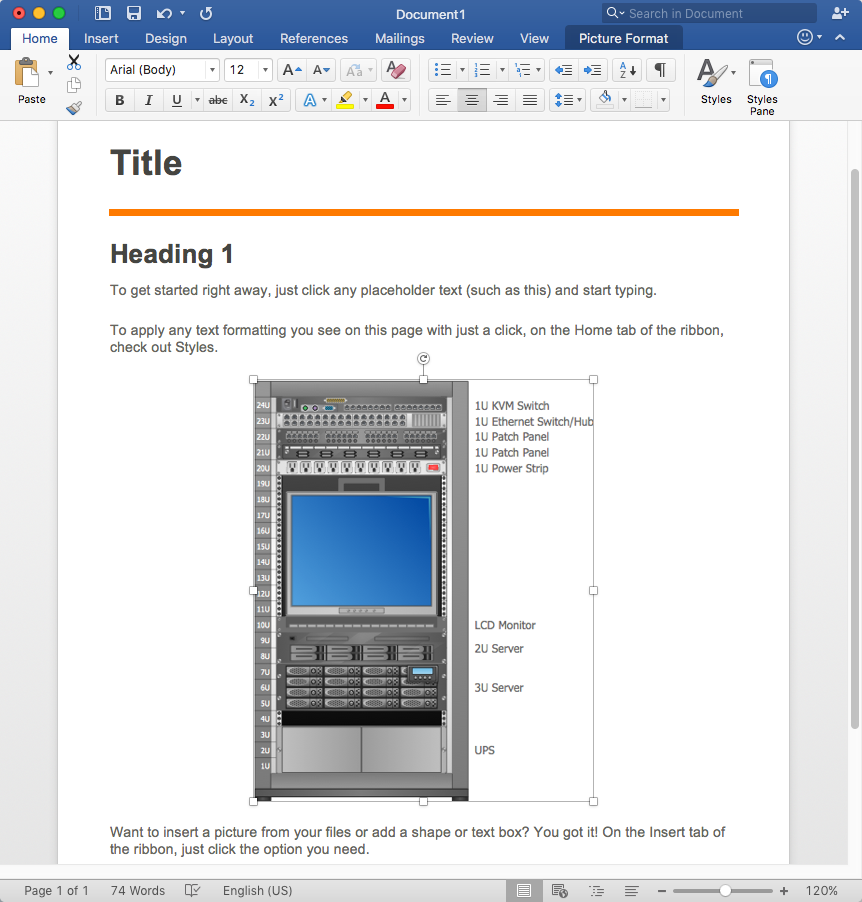
How to Add a Rack Diagram to MS Word Document
- Decision Making | | Workflow Diagram | Decision Making Diagram
- Decision tree diagram | Influence Diagram Software | Decision ...
- Making Mechanical Diagram | CAD Drawing Software for Making ...
- Decision Making | Preventive Action | CORRECTIVE ACTIONS ...
- Block diagram - Customer decision making | Workflow Diagram ...
- Decision Making | Block diagram - Customer decision making ...
- Strategic Decision Making Process Block Diagram
- CORRECTIVE ACTIONS PLANNING. Risk Diagram (PDPC) | How ...
- Decision Making Tree Diagram In Management
- Block Diagrams
- CAD Drawing Software for Making Mechanic Diagram and Electrical ...
- How To Create an Affinity Diagram Using ConceptDraw Office ...
- Block diagram - Customer decision making | Block Diagram ...
- Root Cause Analysis Mac
- Decision Making | How To Make the Right Decision in Projects ...
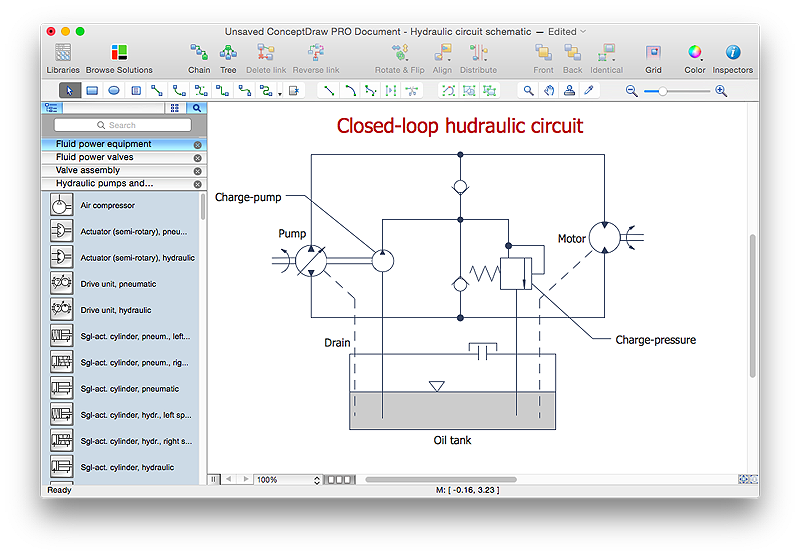
- How to Create an Electrical Diagram Using ConceptDraw PRO ...
- Making Mechanical Diagram | How to Create a Mechanical Diagram ...
- Diagram Chart Of Managerial Decision Making
- Block diagram - Customer decision making | Block Diagrams | Work ...
- Decision Making | Influence Diagram Software | Workflow Diagram ...