HelpDesk
How to Create a Fault Tree Analysis Diagram (FTD) in ConceptDraw PRO

Fault Tree Analysis Software

Process Flowchart


 Fault Tree Analysis Diagrams
This solution extends ConceptDraw PRO v9.5 or later with templates, fault tree analysis example, samples and a library of vector design elements for drawing FTA diagrams (or negative analytical trees), cause and effect diagrams and fault tree diagrams.
 Event-driven Process Chain Diagrams
Event-driven Process Chain (EPC) Diagram is a type of flowchart widely used for modeling in business engineering and reengineering, business process improvement, and analysis. EPC method was developed within the Architecture of Integrated Information Systems (ARIS) framework.
The vector stencils library "Fault tree analysis diagrams" contains 12 symbols for drawing Fault Tree Analysis (FTA) diagrams.
"Fault tree analysis (FTA) is a top down, deductive failure analysis in which an undesired state of a system is analyzed using Boolean logic to combine a series of lower-level events. This analysis method is mainly used in the fields of safety engineering and reliability engineering to understand how systems can fail, to identify the best ways to reduce risk or to determine (or get a feeling for) event rates of a safety accident or a particular system level (functional) failure. FTA is used in the aerospace, nuclear power, chemical and process, pharmaceutical, petrochemical and other high-hazard industries; but is also used in fields as diverse as risk factor identification relating to social service system failure.
In aerospace, the more general term "system Failure Condition" is used for the "undesired state" / Top event of the fault tree. These conditions are classified by the severity of their effects. The most severe conditions require the most extensive fault tree analysis. These "system Failure Conditions" and their classification are often previously determined in the functional Hazard analysis." [Fault tree analysis. Wikipedia]
The shapes example "Fault tree analysis diagrams" was created using the ConceptDraw PRO diagramming and vector drawing software extended with the Fault Tree Analysis Diagrams solution from the Engineering area of ConceptDraw Solution Park.
FTA diagram symbols

Bus Network Topology

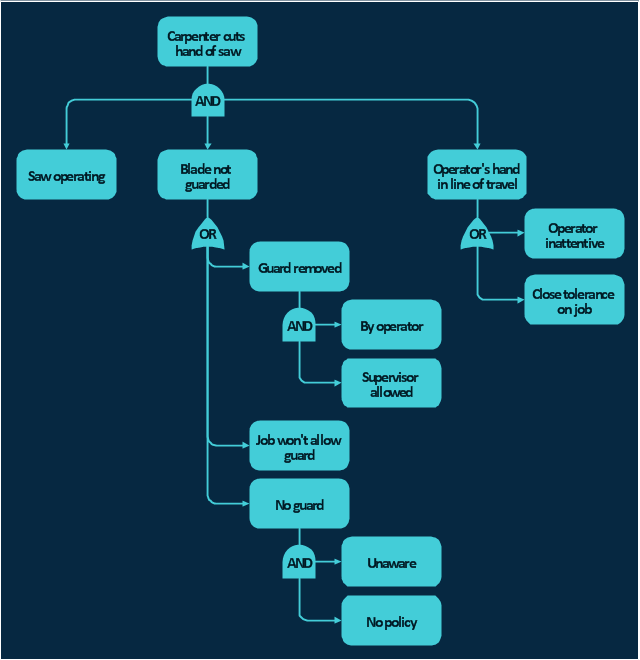
The accident analysis diagram example "Accident analytic tree" was redesigned from the picture 7-14 from the "DOE Workbook. Conducting Accident Investigations. Revision 2."
"Analytic tree analyses are well defined, useful methods that graphically depict, from beginning to end, the events and conditions preceding and immediately following an accident. An analytic tree is a means of organizing information that helps the investigator conduct a deductive analysis of any system (human, equipment, or environmental) to determine critical paths of success and failure. Results from this analysis identify the details and interrelationships that must be considered to prevent the oversights, errors, and omissions that lead to failures. In accident investigations, this type of analysis can consist of both failure paths and success paths, and can lead to neutral, negative, or positive conclusions regarding accident severity.
TIP.
An analytic tree enables the user to:
(1) Systematically identify the possible paths from events to outcome.
(2) Display a graphical record of the analytical process.
(3) Identify management system weaknesses and strengths."
[homer.ornl.gov/ sesa/ corporatesafety/ aip/ docs/ workbook/ Rev2/ chpt7/ chapt7.htm]
The FTA diagram example "Accident analytic tree" was created using the ConceptDraw PRO diagramming and vector drawing software extended with the Fault Tree Analysis Diagrams solution from the Engineering area of ConceptDraw Solution Park.
FTA diagram

The FTA diagram example "Hazard analysis" was redesigned from the illustration of the article "Hazard Analysis Methodologies" from the Occupational Safety & Health Administration (OSHA) website.
"A fault tree analysis is a quantitative assessment of all of the undesirable outcomes, such as a toxic gas release or explosion, which could result from a specific initiating event. It begins with a graphic representation (using logic symbols) of all possible sequences of events that could result in an incident. The resulting diagram looks like a tree with many branches — each branch listing the sequential events (failures) for different independent paths to the top event. Probabilities (using failure rate data) are assigned to each event and then used to calculate the probability of occurrence of the undesired event. ...
This technique is particularly useful in evaluating the effect of alternative actions on reducing the probability of occurrence of the undesired event."
[osha.gov/ SLTC/ etools/ safetyhealth/ mod4_ tools_ methodologies.html]
The FTA diagram example "Hazard analysis" was created using the ConceptDraw PRO diagramming and vector drawing software extended with the Fault Tree Analysis Diagrams solution from the Engineering area of ConceptDraw Solution Park.
FTA diagram
Entity Relationship Diagram Symbols

- Fault Tree Analysis Diagrams | Root cause analysis tree diagram ...
- FTA diagram - Hazard analysis | Accident analytic tree - FTA ...
- Fault Tree Analysis Diagrams | Fault Tree Analysis Software | How to ...
- Root cause analysis tree diagram - Template | Fault Tree Diagram ...
- Fault Tree Diagram Template
- Fault Tree Analysis Example | Fault Tree Analysis Diagrams | How to ...
- Fault Tree Analysis Diagrams
- Fault Tree Analysis Diagrams | How to Create a Fault Tree Analysis ...
- Fault Tree Analysis Diagrams | Fault Tree Analysis Example | Fault ...
- FTA diagram - Hazard analysis | Design elements - Fault tree ...