This site uses cookies. By continuing to browse the ConceptDraw site you are agreeing to our Use of Site Cookies.

Chart Examples

Easy charting software comes with beautiful chart templates and examples. This makes it easy to create professional charts without prior experience.

How to Create a Line Chart

Create a Line Chart with ConceptDraw using our tips. Here you can find an explanation of how to create a line chart quickly.

Chart Templates

Easy charting software comes with beautiful chart templates and examples. This makes it easy to create professional charts without prior experience.

ERD Symbols and Meanings

Crow's foot notation is used in Barker's Notation, Structured Systems Analysis and Design Method (SSADM) and information engineering. Crow's foot diagrams represent entities as boxes, and relationships as lines between the boxes. Different shapes at the ends of these lines represent the cardinality of the relationship.
The Chen's ERD notation is still used and is considered to present a more detailed way of representing entities and relationships.
To create an ERD, software engineers mainly turn to dedicated drawing software, which contain the full notation resources for their specific database design - ERD symbols and meanings. CS Odessa has released an all-inclusive Entity-Relationship Diagram (ERD) solution for their powerful drawing program, ConceptDraw DIAGRAM.
How to Build an Entity Relationship Diagram (ERD)

Flow Chart Symbols

Flowcharts are used in designing and documenting simple processes or programs. Like other types of diagrams, they help visualize what is going on and thereby help understand a process, and perhaps also find flaws, bottlenecks, and other less-obvious features within it. There are many different types of flowcharts, and each type has its own repertoire of boxes and notational conventions.
Flowchart diagrams consists of symbols of process, decision, data and document, data base, termination or initiation processes, processing loops and conditions. To create an drawn flowchart use professional flowchart maker of ConceptDraw DIAGRAM.

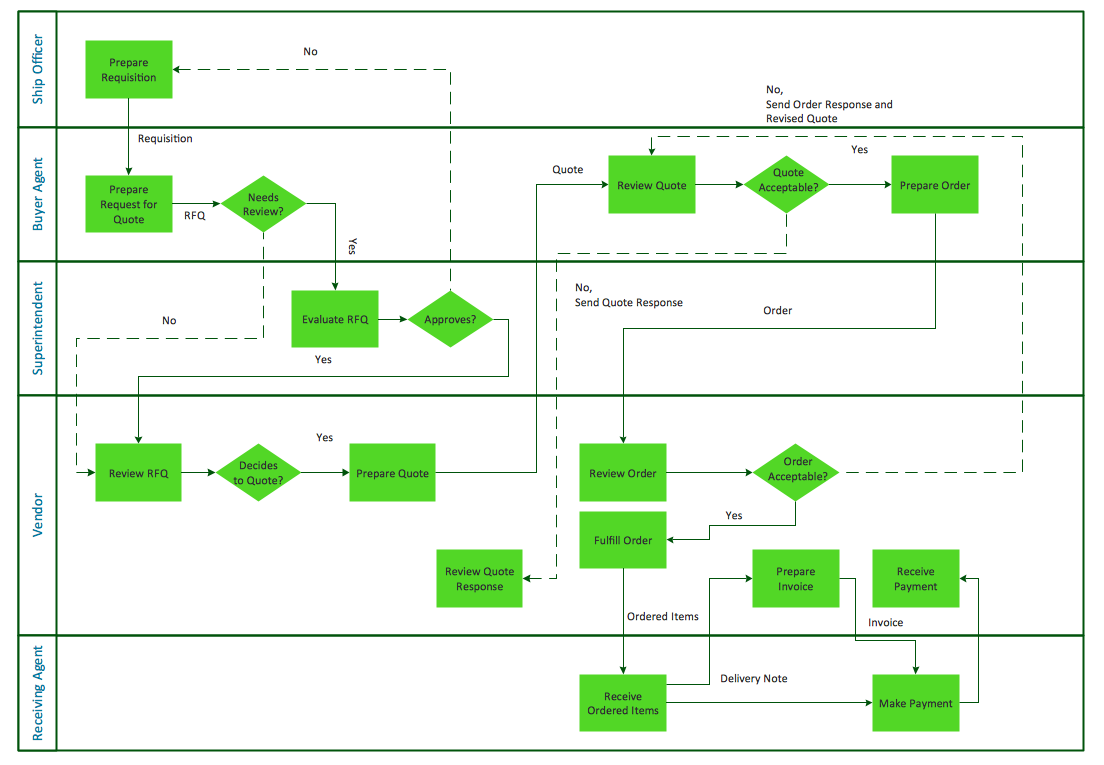
Horizontal Cross Functional Flowchart

ConceptDraw DIAGRAM is a powerful software that helps you create professional looking cross-functional flowcharts with the well-designed objects. ConceptDraw DIAGRAM allows you to focus on work, not the drawing process. ConceptDraw Arrows10 Technology allows to draw connectors with smart behavior that gives flexibility to you during work process.

Ice Hockey Rink Dimensions

Meeting ice hockey rules one should learn ice hockey rink terms, lines, zones etc. ConceptDraw DIAGRAM is an advanced drawing software that allows you produce ice hockey rink depiction of any complexity, from simple sketch drawing to detailed one as on example below.
The vector stencils library "Mac OS X Lion user interface" contains 52 UI design elements.
Use it for designing Mac OS X Lion graphic user interface (GUI) of software for Apple computers in the ConceptDraw PRO diagramming and vector drawing software extended with the Graphic User Interface solution from the Software Development area of ConceptDraw Solution Park.
Title Bar
Title Bar, title bar,
Title Bar Inactive
Title Bar Inactive, title bar,
Window
Window, window,
Window Inactive
Window Inactive, window,
Window Title Bar
Window Title Bar, window,
Window Title Bar (Inactive)
Window Title Bar (Inactive), window,
Full Screen Button
Full Screen Button, full screen button,
Exit Full Screen Button
Exit Full Screen Button, exit full screen button,
Window without Bar
Window without Bar, window,
Window (Narrow Toolbar)
Window (Narrow Toolbar), window,
Window Inactive (Narrow Toolbar)
Window Inactive (Narrow Toolbar), window,
Panel (Hud Window)
Panel (Hud Window), panel,
Panel (Hud Window) (Inactive)
Panel (Hud Window) (Inactive), panel,
Box 1
Box 1, box,
Box 2
Box 2, box,
Field
Field, field,
List View 1
List View 1, list view,
List View 2
List View 2, list view,
Scroll Bar Vertical
Scroll Bar Vertical, scroll bar,
Scroll Bar Horizontal
Scroll Bar Horizontal, scroll bar,
Main Menu
Main Menu, main menu,
Menu Bar
Menu Bar, menu bar,
Menu
Menu, menu,
Vertical Line
Vertical Line,
Horizontal Line
Horizontal Line,
Apple Menu
Apple Menu, Apple menu,
Arrow mark
Arrow mark, arrow,
Combo Box
Combo Box, combo box,
Pop Up Menu
Pop Up Menu, pop up menu,
Text Field
Text Field, text input field,
Count Button
Count Button, count button,
Search Field
Search Field, search field,
Check Box
Check Box, check box,
Check Box
Check Box, check box,
Group of Check Boxes
Group of Check Boxes, group of check boxes,
Radio Button
Radio Button, radio button,
Radio Button
Radio Button, radio button,
Group of Radio Buttons
Group of Radio Buttons, group of radio buttons,
Linear Slider (round thumb)
Linear Slider (round thumb), linear slider,
Linear Slider (directional thumb)
Linear Slider (directional thumb), linear slider,
Circular Slider
Circular Slider, circular slider,
Color Well
Color Well, color well,
Relevance Indicator
Relevance Indicator, relevance indicator,
Rating Indicator
Rating Indicator, rating indicator,
Indeterminate Progress Bar
Indeterminate Progress Bar, progress bar,
Determinate Progress Bar
Determinate Progress Bar, progress bar,
Continuous Capacity Indicator
Continuous Capacity Indicator, capacity indicator,
Discrete Capacity Indicator
Discrete Capacity Indicator, capacity indicator,
Discrete Capacity Indicator (yellow)
Discrete Capacity Indicator (yellow), capacity indicator,
Discrete Capacity Indicator (red)
Discrete Capacity Indicator (red), capacity indicator,
Asynchronous Progress Indicator
Asynchronous Progress Indicator, progress indicator,
Circular Progress Indicator
Circular Progress Indicator, progress indicator,

How to Create a Column Chart

The question how to create a column chart have a simple answer. Use ConceptDraw tips to find out how to create a column chart depicts your data the best way.
HelpDesk

How to Diagram Sentences

Diagramming sentences is a playful, fun way of learning English Grammer. Sentences can be very complex and can contain many different parts of speech which implicate many different grammatical rules. Diagramming sentences will help you to make sure every part of your sentence are grammatically correct and provides you with a more comprehensive understanding of the English Language. A Sentence Diagram displays the parts of a sentence as a diagram in order to show the relationship of words and groups of words within the sentence. Sentence Diagram shows the relationship between the proposal of its parts. This is a good way to teach grammar! Sentence Diagram helps to make the writing more coherent as well as more interesting to read. ConceptDraw DIAGRAM allows you to create clear sentence diagrams using the special templates and vector stencils library.