This is product lifecycle graph (PLC) diagram template.
Use it to design your product lifecycle graphs with ConceptDraw PRO software.
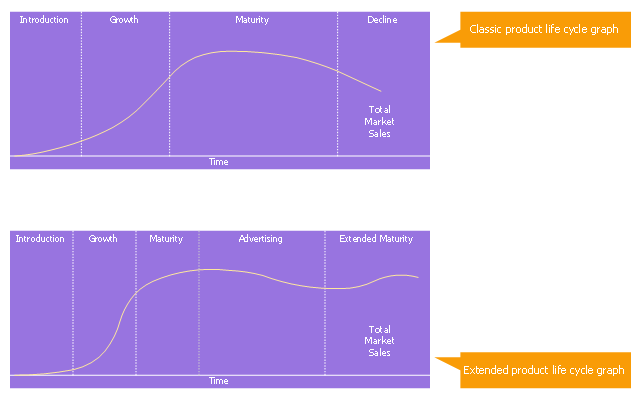
PLC graph visualizes a new product progress through a sequence of stages from introduction to Growth, Maturity, and Decline. This sequence is associated with changes in the marketing situation, thus impacting the marketing strategy and the marketing mix. The product revenue and profits can also be plotted as a function of the PLC stages.
The marketing chart template "Product life cycle graph" is included in the Marketing Diagrams solution from the Marketing area of ConceptDraw Solution Park.
Use it to design your product lifecycle graphs with ConceptDraw PRO software.
PLC graph visualizes a new product progress through a sequence of stages from introduction to Growth, Maturity, and Decline. This sequence is associated with changes in the marketing situation, thus impacting the marketing strategy and the marketing mix. The product revenue and profits can also be plotted as a function of the PLC stages.
The marketing chart template "Product life cycle graph" is included in the Marketing Diagrams solution from the Marketing area of ConceptDraw Solution Park.
Marketing graph template
Basic Diagramming


SWOT matrix template

Successful Strategic Plan

SWOT Sample in Computers

SWOT Analysis Software

Financial Trade UML Use Case Diagram Example

 Circular Arrows Diagrams
Circular Arrows Diagrams solution extends ConceptDraw DIAGRAM with extensive drawing tools, predesigned samples, Circular flow diagram template for quick start, and a library of ready circular arrow vector stencils for drawing Circular Arrow Diagrams, Segmented Cycle Diagrams, and Circular Flow Diagrams. The elements in this solution help managers, analysts, business advisers, marketing experts, scientists, lecturers, and other knowledge workers in their daily work.
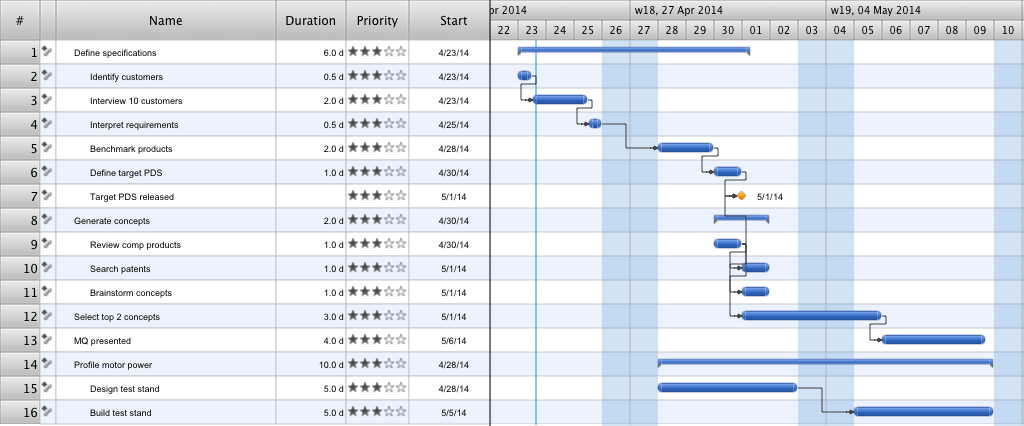
Gantt Chart Templates
Program to Make Flow Chart

- Product life cycle graph | Product life cycle graph - Template | Draw ...
- Marketing Product Life Cycle Template
- Product life cycle graph - Template
- Lifecycle Visio Template
- Systems development life cycle | Circular Arrows Diagrams | Circular ...
- Product life cycle graph | Product life cycle graph - Template | Scatter ...
- Product life cycle graph - Template
- Visio Lifecycle Template
- Sample Lifecycle Diagram In Visio
- BPM life cycle | Pie chart - Template | Virtuous circle (management ...