This site uses cookies. By continuing to browse the ConceptDraw site you are agreeing to our Use of Site Cookies.
HelpDesk

How to Create a Bubble Diagram

Bubble Diagram is a simple chart that consists of circles (bubbles) repesening certain topics or processes. Bubbles are connected by lines depicting the type of relationships between the bubbles. The size of each bubble is depended on the importance of the entity it represents. Bubble charts are widely used throughout social, economical, medical, and other scientific researches as well as throughout architecture and business management. Bubble charts are often used during the early stages of product development to visualize thoughts and ideas for the purpose of sketching out a development plan. ConceptDraw DIAGRAM allows you to draw a bubble diagrams using the Bubble Diagrams solution.

bubble chart, bubble chart creator, bubble diagram Bubble Diagrams

bubble chart, bubble chart creator, bubble diagram
Bubble diagrams have enjoyed great success in software engineering, architecture, economics, medicine, landscape design, scientific and educational process, for ideas organization during brainstorming, for making business illustrations, presentations, planning, design, and strategy development. They are popular because of their simplicity and their powerful visual communication attributes.
HelpDesk

How to Add a Bubble Diagram to PowerPoint Presentation

Bubble diagrams can be used to compare concepts and identify areas of similarity and difference. ConceptDraw DIAGRAM allows you to make an MS PowerPoint Presentation from your charts in a few simple steps. A bubble diagram is a chart that represents information visually in the form of a series of bubbles. Bubble charts are often used in marketing and management during the early stages of product development to visualize ideas and concepts by organizing them in a hierarchy. The ability to create this form of a diagram is contained within the Bubble Diagrams solution. A PowerPoint presentation of bubble diagrams can be used to demonstrate and identify areas of similarity and difference of featured business ideas and concepts.

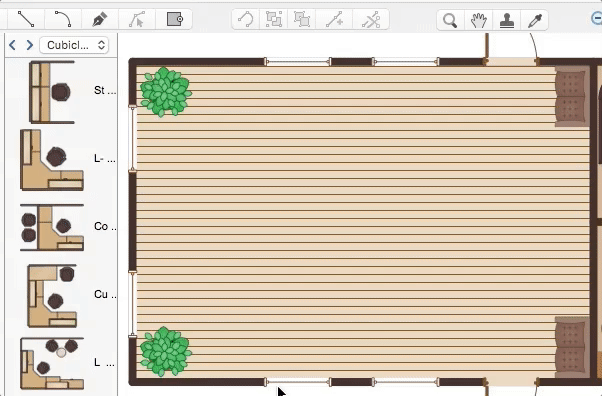
Bubble diagrams in Landscape Design with ConceptDraw DIAGRAM

To define the links between the different areas of your own landscape design and see the project from aside, we recommend to draw landscape diagram called bubble one which is analogue of «mind maps» as it allows us to create approximate image of our future proper landscape view. Use special libraries (and we have plenty of them) with objects of landscape design to be able to create the detailed plan of your landscape which will be looking so smart and professionally good as the samples we provide were created by designers who know so much about making such kinds of design plans. Having ConceptDraw DIAGRAM as the assistant in your work, will ensure the success after using our product. Make the bubble diagrams as well as any other ones in minutes with ease having our application called ConceptDraw DIAGRAM and you will see how quick it will change your life simplifying lots of work.
HelpDesk

How to Add a Self-Drawn Object to a Library

One of the key elements of ConceptDraw DIAGRAM solutions are the libraries, containing a set of associated objects. Using these collections of business-oriented vector objects, you can quickly get started making the diagram in the theme you need. The library collection can be supplemented by creating new or editing existing objects. You can create your own unique library just by dragging objects with the mouse. Library objects can be customized and saved for later use. You can change the scaling, color, line weight, label, and even the fill pattern of an object to use in custom drawings and diagrams. Your custom objects even can be searched for the next time you need to use them.
HelpDesk

How to Create Cisco Network Diagram

Cisco Network chart can be a great start for detailed network documentation, as well as serve as a visual instruction for new IT staff, or as a detailed illustration for a presentation. The easiest way to design the Cisco Network diagram using standard Cisco product symbols is using ConceptDraw DIAGRAM powered by the Cisco Network Diagrams solution. The Cisco Network Diagrams solution uses Cisco network symbols and icons to visually document the Cisco network topology and design of Cisco network diagrams. Using ConceptDraw libraries you can access a wide array of Cisco network icons, so you can quickly prototype a new network or document an existing one.
HelpDesk

How to Contribute Drawing With Library Objects

ConceptDraw DIAGRAM comes with an (almost!) endless library of graphics, templates and solutions to help you with anything from the most basic flowcharts to complex engineering schematics. Live Object technology visualises data sources. Create dynamic diagrams that update themselves. There's more - it's compatible with MS Visio XML files; a solution across platforms. Discover the methods of placing object into your drawing using ConceptDraw DIAGRAM.