HelpDesk
How to Draw a Fishbone Diagram with ConceptDraw PRO

HelpDesk
How to Add a Fishbone Diagram to a PowerPoint Presentation Using ConceptDraw PRO

 Interactive Voice Response Diagrams
Interactive Voice Response Diagrams solution extends ConceptDraw PRO v10 software with samples, templates and libraries of ready-to-use vector stencils that help create Interactive Voice Response (IVR) diagrams illustrating in details a work of interactive voice response system, the IVR system’s logical and physical structure, Voice-over-Internet Protocol (VoIP) diagrams, and Action VoIP diagrams with representing voice actions on them, to visualize how the computers interact with callers through voice recognition and dual-tone multi-frequency signaling (DTMF) keypad inputs.
 Mind Map Exchange
This solution extends ConceptDraw MINDMAP software with the ability to easily exchange mind maps with a large variety of other mind mapping applications.
 Word Exchange
This solution extends ConceptDraw MINDMAP software with the ability to quickly create the framework for a future article or book, fill the structure with ideas, and use it to produce an MS Word document with just a simple click of the mouse.
 Fishbone Diagram
Fishbone Diagrams solution extends ConceptDraw PRO software with templates, samples and library of vector stencils for drawing the Ishikawa diagrams for cause and effect analysis.
Collaboration in a Project Team

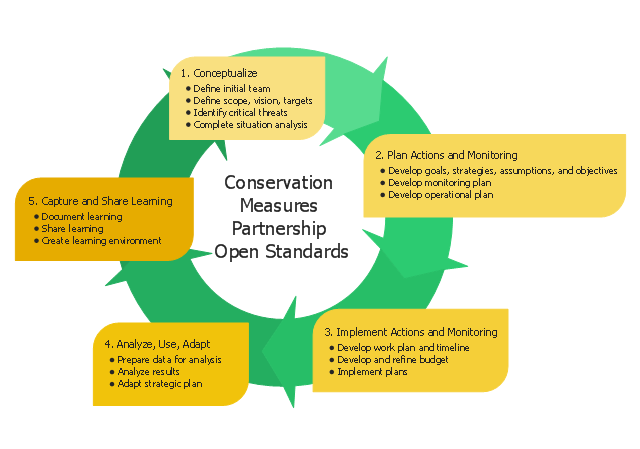
This circular arrows diagram sample shows five steps of the Conservation Measures Partnership (CMP) adaptive management cycle. It was designed on the base of the Wikimedia Commons file: CMP Cycle - 2008-02-20.jpg.
[commons.wikimedia.org/ wiki/ File:CMP_ Cycle_ -_ 2008-02-20.jpg]
"Adaptive management (AM), also known as adaptive resource management (ARM), is a structured, iterative process of robust decision making in the face of uncertainty, with an aim to reducing uncertainty over time via system monitoring. In this way, decision making simultaneously meets one or more resource management objectives and, either passively or actively, accrues information needed to improve future management. Adaptive management is a tool which should be used not only to change a system, but also to learn about the system. Because adaptive management is based on a learning process, it improves long-run management outcomes. The challenge in using the adaptive management approach lies in finding the correct balance between gaining knowledge to improve management in the future and achieving the best short-term outcome based on current knowledge.
Application to environmental projects and programs.
Open Standards for the Practice of Conservation lay out 5 main steps to an adaptive management project cycle." [Adaptive management. Wikipedia]
The diagram example "CMP adaptive management cycle" was created using the ConceptDraw PRO diagramming and vector drawing software extended with the Circular Arrows Diagrams solution from the area "What is a Diagram" of ConceptDraw Solution Park.
Circular arrows diagram
Used Solutions
- How to draw Metro Map style infographics ? (London) | Infographic ...
- How to draw Metro Map style infographics ? Moscow, New York, Los ...
- Marketing Plan Infographic | HVAC Marketing Plan | Marketing plan ...
- Fire Exit Plan. Building Plan Examples | Building Drawing Software ...
- London tube map | How to draw Metro Map style infographics ...
- Food security assessment - Flowchart | Opportunities in agro and ...
- Line Graph Of Population
- Line Chart Examples | San Francisco population history | Regional ...
- Agile Scrum Sprint
- Online store social media response flowchart | Social Media ...
- Scrum Workflow | Agile Methodology | PM Agile | Agile With Scrum
- Scrum Defined
- ELR route map | ARL route map | The 100th Tour de France - Route ...
- Fire Exit Plan. Building Plan Examples | Basic Flowchart Symbols ...
- Swot Analysis In Change Management
- Agile Mind Maps: Exploring the User Wishes | Scrum process work ...
- Easy Drawing For Metro
- Fire Exit Plan. Building Plan Examples | Geo Mapping Software ...
- Social strategy - Pyramid diagram | Online store social media ...
- Fire Exit Plan. Building Plan Examples | Emergency Plan ...