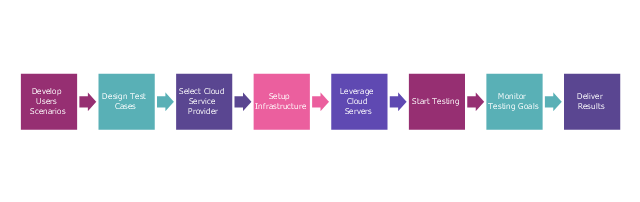
This step diagram example shows cloud testing steps. It was redesigned from the Wikimedia Commons file: Cloud Testing steps.png. [commons.wikimedia.org/ wiki/ File:Cloud_ Testing_ steps.png]
This file is licensed under the Creative Commons Attribution-Share Alike 3.0 Unported license. [creativecommons.org/ licenses/ by-sa/ 3.0/ deed.en]
"Cloud testing is a form of software testing in which web applications use cloud computing environments (a "cloud") to simulate real-world user traffic. ...
Cloud Testing uses cloud infrastructure for software testing. Organizations pursuing testing in general and load, performance testing and production service monitoring in particular are challenged by several problems like limited test budget, meeting deadlines, high costs per test, large number of test cases, and little or no reuse of tests and geographical distribution of users add to the challenges. Moreover ensuring high quality service delivery and avoiding outages requires testing in one's datacenter, outside the data-center, or both. Cloud Testing is the solution to all these problems. Effective unlimited storage, quick availability of the infrastructure with scalability, flexibility and availability of distributed testing environment reduce the execution time of testing of large applications and lead to cost-effective solutions." [Cloud testing. Wikipedia]
The step chart example "Cloud testing steps" was created using the ConceptDraw PRO diagramming and vector drawing software extended with the Marketing Diagrams solution from the Marketing area of ConceptDraw Solution Park.
Marketing diagram
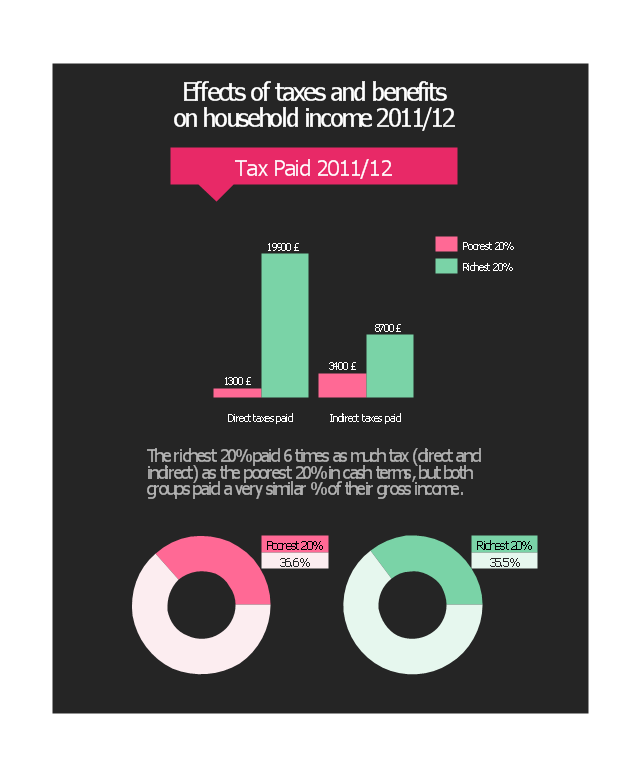
This data-driven infographic example was redesigned from the Wikimedia Commons file: Effects of tax and benefits on household income in the UK 2011 - 2012.png.
"Before taxes and benefits, the richest fifth of households had an average income of £78,300 in 2011/ 12, 14 times greater than the poorest fifth, who had an average income of £5,400.
Overall, taxes and benefits lead to income being shared more equally between households. After all taxes and benefits are taken into account, the ratio between the average incomes of the top and the bottom fifth of households (£57,300 per year and £15,800 respectively) is reduced to four-to-one."
[commons.wikimedia.org/ wiki/ File:Effects_ of_ tax_ and_ benefits_ on_ household_ income_ in_ the_ UK_ 2011_ -_ 2012.png]
The bar graph and donut chart sample "Effects of taxes and benefits" was created using the ConceptDraw PRO diagramming and vector graphics software extended with the Data-driven Infographics" solution from the area "What is infographics" of ConceptDraw Solution Park.
Data-driven infographics
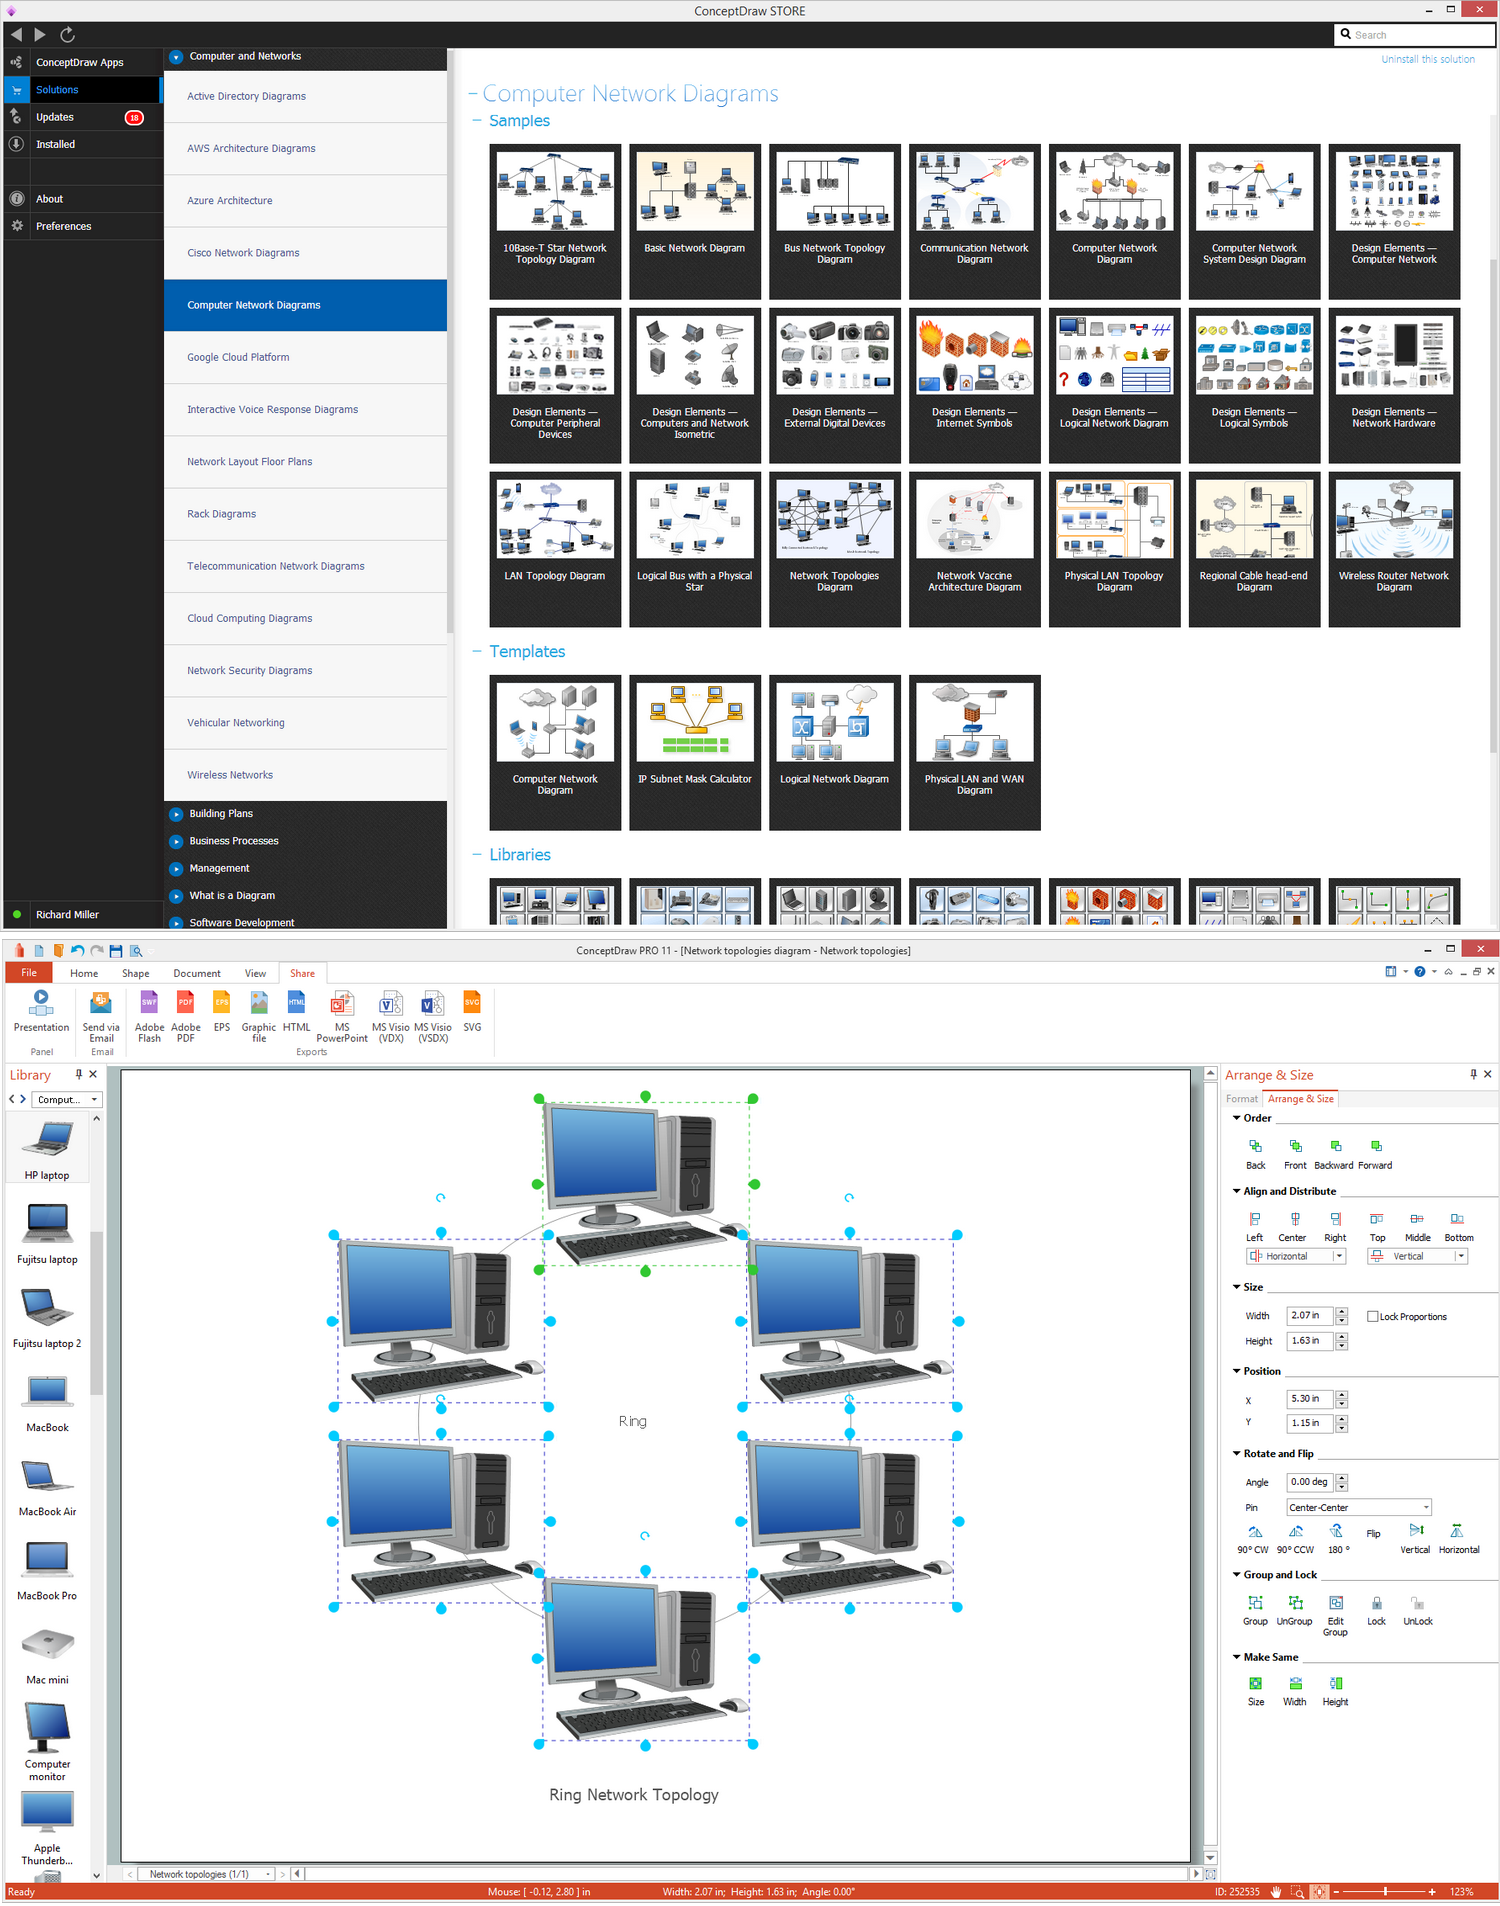
Ring Network Topology
Basic Flowchart Symbols and Meaning


 Funnel Diagrams
Funnel Diagrams solution including wide range of funnel diagram samples, sales funnel examples, and vector design elements, makes the ConceptDraw DIAGRAM ideal for funnel management and creation the Funnel Diagrams of different types and designs, AIDA Model, AIDAS, ACCA Dagmar, Rossiter-Percy Model, Sales funnel, Marketing funnel, Search funnel, Brand funnel, Purchase funnel, Lead funnel, Conversion funnel, Business funnel, etc. You are free to choose to place your funnel object horizontally or vertically, you can use the objects with desired quantity of sales funnel stages, as well as to modify their size, color filling, and other parameters to make exceptionally looking Funnel diagrams fully responding to your desires.
 Sales Flowcharts
The Sales Flowcharts solution lets you create and display sales process maps, sales process workflows, sales steps, the sales process, and anything else involving sales process management.
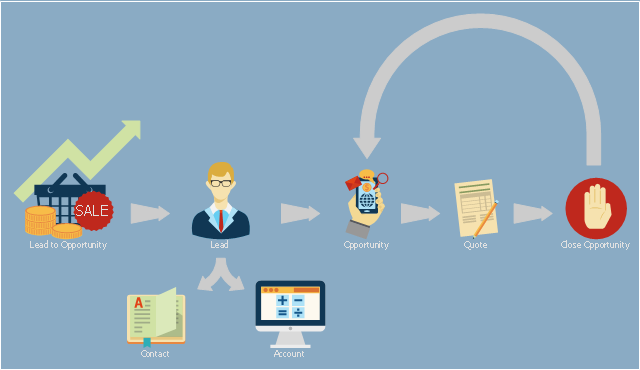
This presales process flowchart example depicts the Microsoft Dynamics CRM workflow from lead to opportunity. It was redesigned from the Wikimedia Commons file: Lead to Opportunity sales flow.svg. [commons.wikimedia.org/ wiki/ File:Lead_ to_ Opportunity_ sales_ flow.svg]
"Presales is a process or a set of activities normally carried out before a customer is acquired, though sometimes presales also extends into the period the product or service is delivered to the customer. ...
In a typical sales cycle the stages are:
(1) Contact.
(2) Lead / Suspect.
(3) Prospect / Opportunity.
The task of a presales person starts from the initial contact phase and often ends once the customer is acquired i.e. sale is made." [Presales. Wikipedia]
The process flowchart example "Lead to opportunity sales flow" was created using the ConceptDraw PRO diagramming and vector drawing software extended with the Sales Flowcharts solution from the Marketing area of ConceptDraw Solution Park.
Presales process flowchart
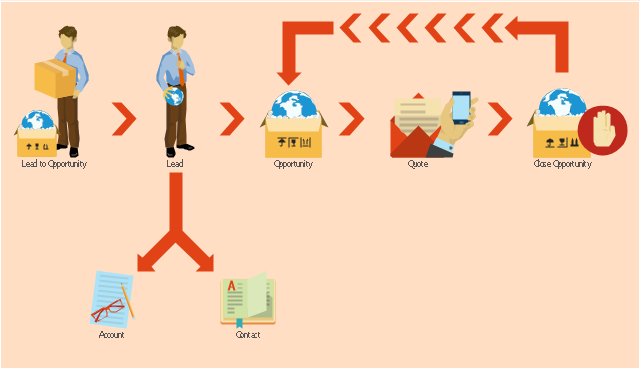
This example shows the Microsoft Dynamics CRM workflow from lead to opportunity. It was redesigned from the Wikimedia Commons file: Lead to Opportunity sales flow.svg. [commons.wikimedia.org/ wiki/ File:Lead_ to_ Opportunity_ sales_ flow.svg]
"Does your lead have what you're looking for - and vice versa? Once you've identified the timeframe, budget, purchase process, and decision makers for the sale, it's time to qualify your lead. Qualifying a lead in Microsoft Dynamics CRM converts it to an opportunity.
Ideally, your leads or prospects should have a need that you can provide a solution for, and have the budget and influence necessary for making the purchasing decision. In addition, you should be able to provide their solution within the timeframe they need it." [microsoft.com/ en-us/ dynamics/ crm-customer-center/ qualify-a-lead-and-convert-it-to-an-opportunity.aspx]
The example "Workflow - Lead to Opportunity" was created using the ConceptDraw PRO diagramming and vector drawing software extended with the Sales Flowcharts solution from the Marketing area of ConceptDraw Solution Park.
Sales workflow diagram
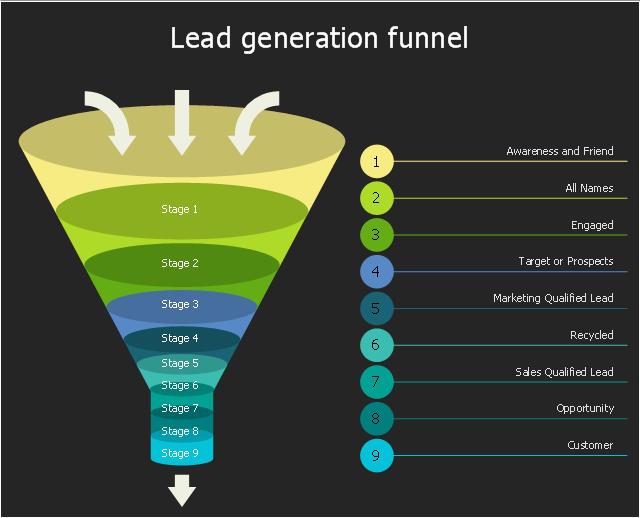
This funnel diagram sample shows 9 stages of lead generation funnel: Awareness and Friend, All Names, Engaged, Target or Prospects, Marketing Qualified Lead, Recycled, Sales Qualified Lead, Opportunity, Customer.
"Generating leads is one of the most critical steps in sales and marketing for this is where businesses get their precious pool of prospects that can eventually become paying customers. Lead generation however involves a careful process that if done right can deliver a huge ROI at the fastest possible time. This process undergo what marketers call a Lead Generation Funnel.
Understanding the process and stages behind a lead generation funnel is critical for marketers to successfully move names and contacts gathered through their marketing efforts and turning them into customers." [digitalmarketingphilippines.com/ lead-generation-funnel-what-is-it-and-how-does-it-work/ ]
The funnel diagram example "Lead generation funnel" was designed using ConceptDraw PRO software extended with Funnel Diagrams solution from Marketing area of ConceptDraw Solution Park.
Marketing diagram