 Cross-Functional Flowcharts
Cross-functional flowcharts are powerful and useful tool for visualizing and analyzing complex business processes which requires involvement of multiple people, teams or even departments. They let clearly represent a sequence of the process steps, the order of operations, relationships between processes and responsible functional units (such as departments or positions).
Audit Process Flowchart. Audit Flowchart

Purchasing Flow Chart. Purchasing Flowchart Example

 Business Process Diagrams
Business Process Diagrams solution extends the ConceptDraw DIAGRAM BPM software with RapidDraw interface, templates, samples and numerous libraries based on the BPMN 1.2 and BPMN 2.0 standards, which give you the possibility to visualize equally easy simple and complex processes, to design business models, to quickly develop and document in details any business processes on the stages of project’s planning and implementation.
Basic Audit Flowchart. Flowchart Examples

Financial Comparison Chart

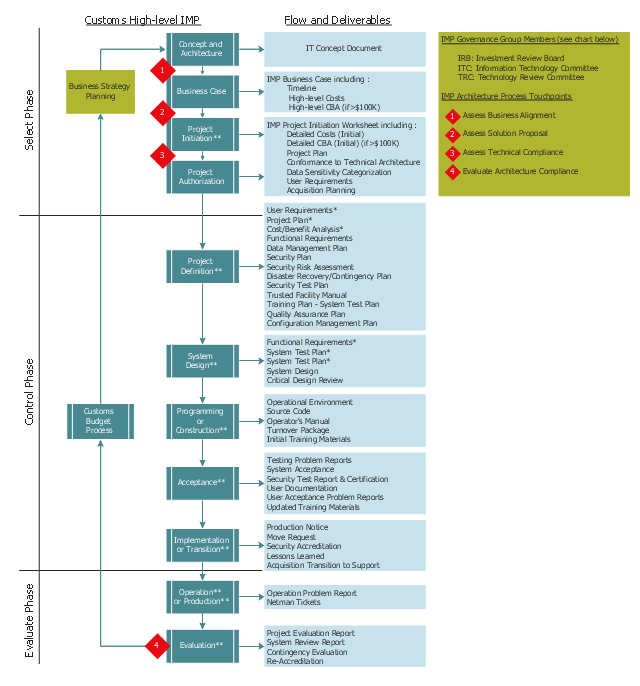
This cross-functional flowchart example shows the investment management process flow. It was designed on the base of the Wikimedia Commons file: Investment Management Process Example.jpg. [commons.wikimedia.org/ wiki/ File:Investment_ Management_ Process_ Example.jpg]
"Investment management is the professional asset management of various securities (shares, bonds and other securities) and other assets (e.g., real estate) in order to meet specified investment goals for the benefit of the investors. Investors may be institutions (insurance companies, pension funds, corporations, charities, educational establishments etc.) or private investors (both directly via investment contracts and more commonly via collective investment schemes e.g. mutual funds or exchange-traded funds)." [Investment management. Wikipedia]
The swim lane diagram sample "Investment management process" was created using the ConceptDraw PRO diagramming and vector drawing software extended with the Cross-Functional Flowcharts solution from the Business Processes area of ConceptDraw Solution Park.
Cross-functional flowchart
Prioritization Matrix

The vector stencils library "Workflow finance" contains 12 financial icons.
Use it to design your business process workflow diagrams with ConceptDraw PRO software.
"Corporate finance is the area of finance dealing with the sources of funding and the capital structure of corporations and the actions that managers take to increase the value of the firm to the shareholders, as well as the tools and analysis used to allocate financial resources. The primary goal of corporate finance is to maximize or increase shareholder value. ...
Investment analysis (or capital budgeting) is concerned with the setting of criteria about which value-adding projects should receive investment funding, and whether to finance that investment with equity or debt capital. Working capital management is the management of the company's monetary funds that deal with the short-term operating balance of current assets and current liabilities; the focus here is on managing cash, inventories, and short-term borrowing and lending (such as the terms on credit extended to customers)." [Corporate finance. Wikipedia]
The icons example "Design elements - Workflow finance" is included in the Business Process Workflow Diagrams solution from the Business Processes area of ConceptDraw Solution Park.
Financial icons
 Event-driven Process Chain Diagrams
Event-Driven Process Chain Diagrams solution extends ConceptDraw DIAGRAM functionality with event driven process chain templates, samples of EPC engineering and modeling the business processes, and a vector shape library for drawing the EPC diagrams and EPC flowcharts of any complexity. It is one of EPC IT solutions that assist the marketing experts, business specialists, engineers, educators and researchers in resources planning and improving the business processes using the EPC flowchart or EPC diagram. Use the EPC solutions tools to construct the chain of events and functions, to illustrate the structure of a business process control flow, to describe people and tasks for execution the business processes, to identify the inefficient businesses processes and measures required to make them efficient.
- Cross-Functional Flowcharts | Investment Banking Process Flow Chart
- Use Case Diagram For Investment Banking
- Process Flowchart | Investment and construction application ...
- Flow Chart Of Investment Process
- Use Case Diagram Example For Investment
- Investment Banking Process Flow
- Taxi service order procedure - BPMN 1.2 diagram | Proposed ...
- Investment Banking Use Case Diagram
- Banking Process Flow Diagram
- Investment Accounting Process Flow