The vector stencils library "Workflow finance" contains 12 financial icons.
Use it to design your business process workflow diagrams with ConceptDraw PRO software.
"Corporate finance is the area of finance dealing with the sources of funding and the capital structure of corporations and the actions that managers take to increase the value of the firm to the shareholders, as well as the tools and analysis used to allocate financial resources. The primary goal of corporate finance is to maximize or increase shareholder value. ...
Investment analysis (or capital budgeting) is concerned with the setting of criteria about which value-adding projects should receive investment funding, and whether to finance that investment with equity or debt capital. Working capital management is the management of the company's monetary funds that deal with the short-term operating balance of current assets and current liabilities; the focus here is on managing cash, inventories, and short-term borrowing and lending (such as the terms on credit extended to customers)." [Corporate finance. Wikipedia]
The icons example "Design elements - Workflow finance" is included in the Business Process Workflow Diagrams solution from the Business Processes area of ConceptDraw Solution Park.
Financial icons
 Business Process Workflow Diagrams
The Business Process Workflow Diagrams solution enhances the ConceptDraw DIAGRAM functionality with predesigned examples, samples and a numerous collection of predesigned vector objects of workflow chart elements, icons, arrows, connectors, and varied wor
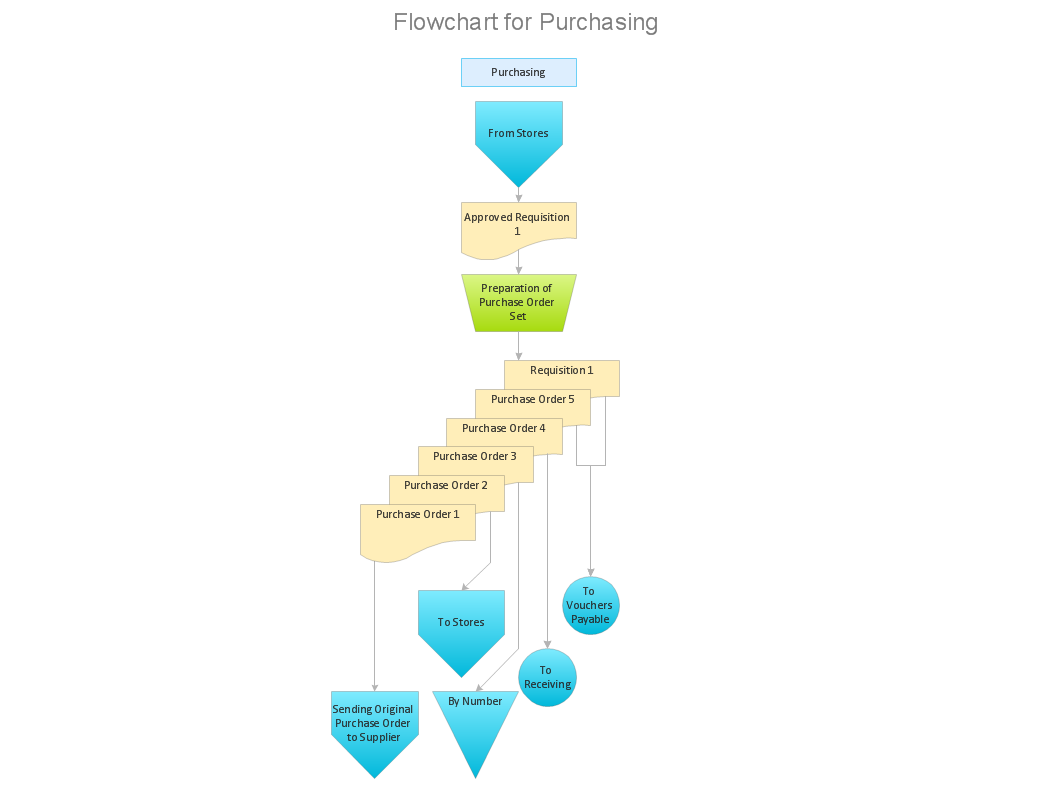
Workflow to Make a Purchase. Accounting Flowchart Example
 Cross-Functional Flowcharts
Cross-functional flowcharts are powerful and useful tool for visualizing and analyzing complex business processes which requires involvement of multiple people, teams or even departments. They let clearly represent a sequence of the process steps, the order of operations, relationships between processes and responsible functional units (such as departments or positions).
Workflow Flowchart Symbols

Prioritization Matrix

Business Process Workflow Diagram


How to Present Workflow to Team
Software Work Flow Process in Project Management with Diagram

This sample shows the Workflow Diagram that clearly illustrates stages a BPM consists of and relations between all parts of business. The Workflow Diagrams are used to represent the transferring of data during the work process, to study and analysis the working processes, and to optimize a workflow.
- Workflow to Make a Purchase. Accounting Flowchart Example ...
- Investment Vector Icon
- Process Flowchart | Design elements - Workflow finance | Basic ...
- Design elements - Workflow finance | Business Process Workflow ...
- Investment management process | Management pictograms - Vector ...
- Finance Workflow Process
- Design Workflow
- Design elements - Workflow finance
- Bar Diagrams for Problem Solving. Create economics and financial ...
- Process Flowchart | UML Diagram | Interactive Voice Response ...