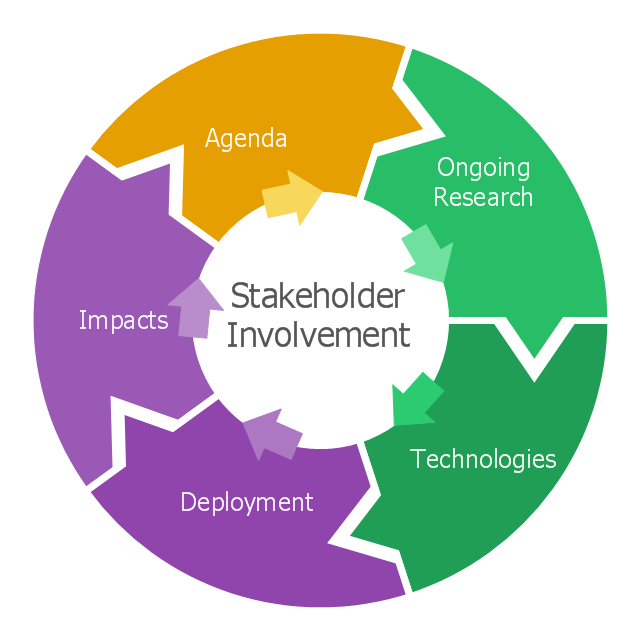
This arrow loop cycle diagram sample was created on the base of the figure illustrating the webpage "Exploratory Advanced Research Program Hand-Off Workshops" from the US Department of Transportation - Federal Highway Administration (FHWA) website. "The FHWA’s research and technology innovation life cycle illustrates that research and technology development are not insular activities, but integrated processes that together constitute a system.
Following general workshop discussion, a number of common issues emerged among the groups. These centered around the research life cycle, communicating the value of exploratory advanced research, and continued project funding. It was felt that there is a general need to better describe the research and deployment cycle specific to highway transportation and possibly to highway research fields, such as materials or system planning. Research life cycle diagrams show a very linear, chronological process but it is not necessarily that way in reality." [fhwa.dot.gov/ advancedresearch/ pubs/ 11034/ ]
The arrow loop diagram example "Innovation life cycle" was created using the ConceptDraw PRO diagramming and vector drawing software extended with the Target and Circular Diagrams solution from the Marketing area of ConceptDraw Solution Park.
www.conceptdraw.com/ solution-park/ marketing-target-and-circular-diagrams
Arrow loop cycle diagram
This circular arrows diagram sample shows the innovation life cycle stages. It was designed on the base of the from the website of the Federal Highway Administration (FHWA) of the U.S. Department of Transportation (DOT). [fhwa.dot.gov/ advancedresearch/ pubs/ 11034/ ]
"Innovation is defined simply as a "new idea, device, or method". However, innovation is often also viewed as the application of better solutions that meet new requirements, unarticulated needs, or existing market needs. This is accomplished through more-effective products, processes, services, technologies, or business models that are readily available to markets, governments and society." [Innovation. Wikipedia]
The diagram example "Innovation life cycle" was created using the ConceptDraw PRO diagramming and vector drawing software extended with the Circular Arrows Diagrams solution from the area "What is a Diagram" of ConceptDraw Solution Park.
Circular arrows diagram
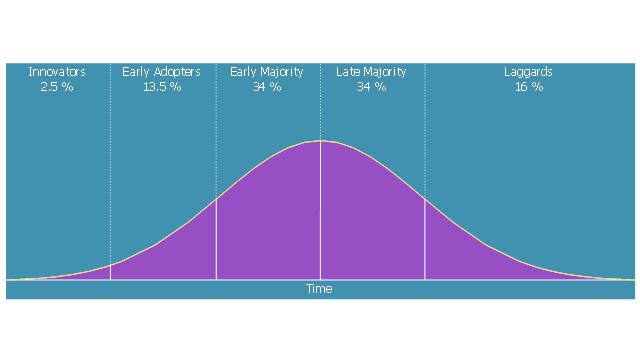
Diffusion of innovations (DOI) diagram illustrate the diffusion of innovations theory.
"Diffusion of innovations is a theory that seeks to explain how, why, and at what rate new ideas and technology spread through cultures. Everett Rogers, a professor of communication studies, popularized the theory in his book Diffusion of Innovations... The book says that diffusion is the process by which an innovation is communicated through certain channels over time among the members of a social system. ... The book espouses the theory that there are four main elements that influence the spread of a new idea: the innovation, communication channels, time, and a social system. This process relies heavily on human capital. The innovation must be widely adopted in order to self-sustain. Within the rate of adoption, there is a point at which an innovation reaches critical mass. The categories of adopters are: innovators, early adopters, early majority, late majority, and laggards ... Diffusion of Innovations manifests itself in different ways in various cultures and fields and is highly subject to the type of adopters and innovation-decision process." [Diffusion of innovations. Wikipedia]
This DOI chart example was created using the ConceptDraw PRO diagramming and vector drawing software extended with the Marketing Diagrams solution from the Marketing area of ConceptDraw Solution Park.
Diffusion of innovations (DOI)
-diffusion-of-innovations-graph.png--diagram-flowchart-example.png)
How to Create a Cross Functional Flow Chart

 Circular Arrows Diagrams
Circular Arrows Diagrams solution extends ConceptDraw PRO v10 with extensive drawing tools, predesigned samples, Circular flow diagram template for quick start, and a library of ready circular arrow vector stencils for drawing Circular Arrow Diagrams, Segmented Cycle Diagrams, and Circular Flow Diagrams. The elements in this solution help managers, analysts, business advisers, marketing experts, scientists, lecturers, and other knowledge workers in their daily work.
 Target and Circular Diagrams
This solution extends ConceptDraw PRO software with samples, templates and library of design elements for drawing the Target and Circular Diagrams.
 Project Management Area
Project Management area provides Toolbox solutions to support solving issues related to planning, tracking, milestones, events, resource usage, and other typical project management functions.
This hexagon diagram sample was redesigned from the Wikipedia file: Virtuous circle in macroeconomics.svg. "An example of the use of a virtuous circle in macroeconomics."
[en.wikipedia.org/ wiki/ File:Virtuous_ circle_ in_ macroeconomics.svg]
"A virtuous circle and a vicious circle (also referred to as virtuous cycle and vicious cycle) are economic terms. They refer to a complex chain of events that reinforces itself through a feedback loop. A virtuous circle has favorable results, while a vicious circle has detrimental results.
Both circles are complexes of events with no tendency towards equilibrium (at least in the short run). Both systems of events have feedback loops in which each iteration of the cycle reinforces the previous one (positive feedback). These cycles will continue in the direction of their momentum until an external factor intervenes and breaks the cycle. The prefix "hyper-" is sometimes used to describe these cycles if they are extreme. The best-known example of a vicious circle is hyperinflation. ...
Example in macroeconomics.
Virtuous circle.
Economic growth can be seen as a virtuous circle. It might start with an exogenous factor such as technological innovation. As people get familiar with the new technology, there could be learning curve effects and economies of scale. This could lead to reduced costs and improved production efficiencies. In a competitive market structure, this will probably result in lower average prices or a decrease in employment as it takes fewer workers to produce the same output. As prices decrease, consumption could increase and aggregate output also. Increased levels of output lead to more learning and scale effects and a new cycle starts."
[en.wikipedia.org/ wiki/ Virtuous_ circle_ and_ vicious_ circle]
The crystal diagram example "Virtuous circle (macroeconomics)" was created using the ConceptDraw PRO diagramming and vector drawing software extended with the Target and Circular Diagrams solution from the Marketing area of ConceptDraw Solution Park.
www.conceptdraw.com/ solution-park/ marketing-target-and-circular-diagrams
Hexagon diagram
---crystal-diagram.png--diagram-flowchart-example.png)
The vector stencils library "Marketing diagrams" contains 9 templates of marketing and sales diagrams and charts.
Use these shapes to illustrate your marketing and sales documents, presentations, infographics and webpages in the ConceptDraw PRO diagramming and vector drawing software extended with the Marketing Diagrams solution from the Marketing area of ConceptDraw Solution Park.
www.conceptdraw.com/ solution-park/ marketing-diagrams
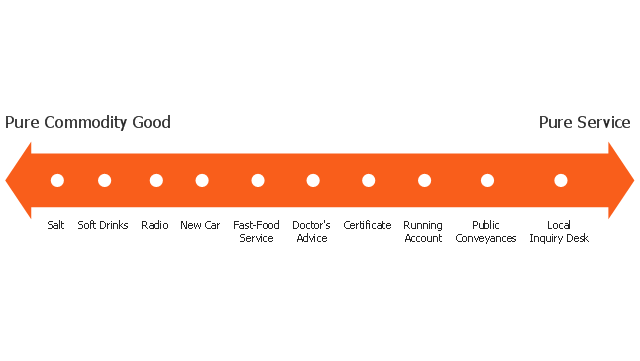
Service-goods continuum diagram
Diffusion of Innovations
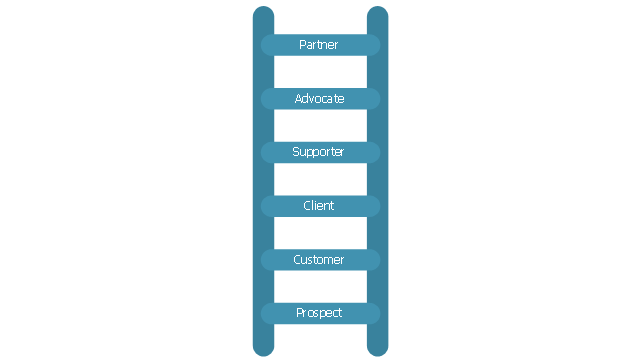
Relationship ladder of customer loyalty
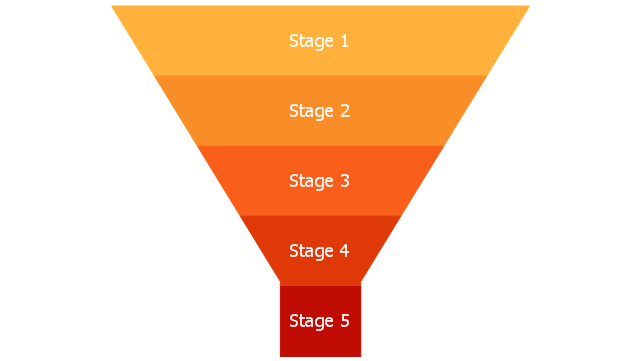
Leaky bucket diagram

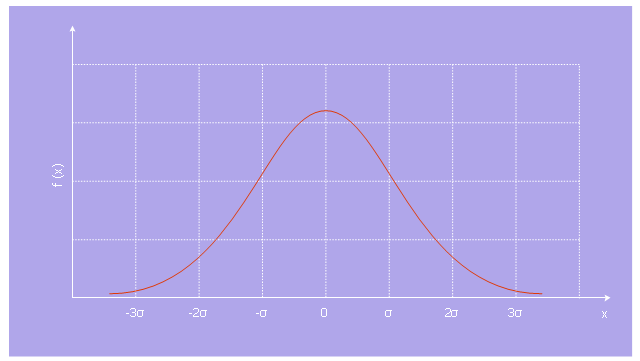
Normal distribution
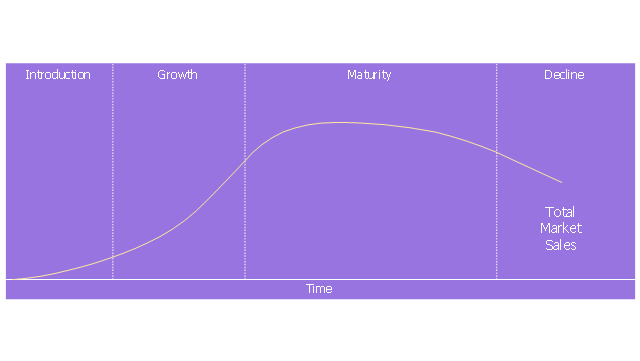
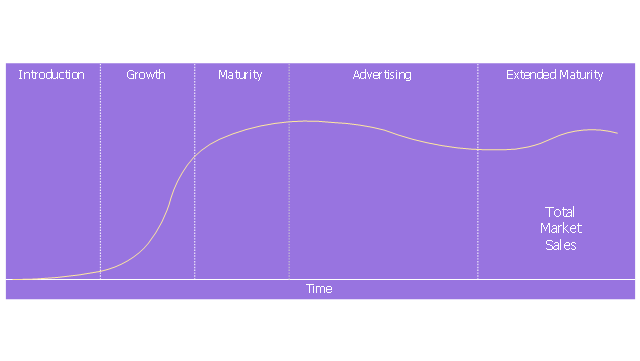
Product life cycle graph
Extended product life cycle graph
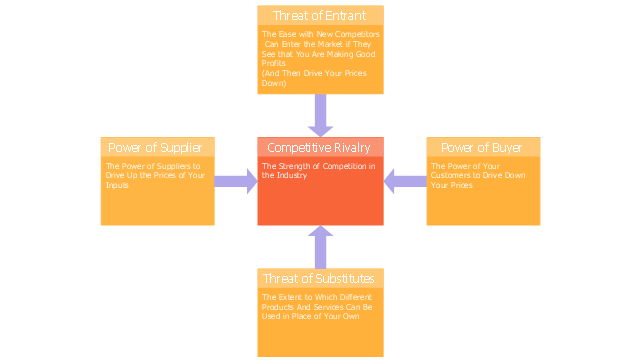
Five forces model
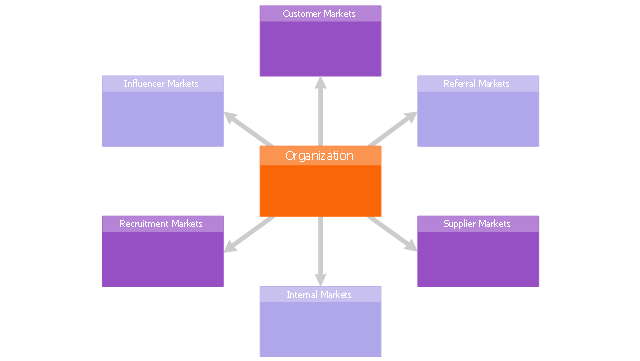
Six markets model
Step chart block
Step diagram block

 Marketing Diagrams
This solution extends ConceptDraw PRO with samples, templates and library of design elements for drawing the marketing diagrams.
Cubetto Flowchart

- Diffusion of innovations graph | Marketing Diagrams | Diffusion Of ...
- Innovation life cycle - Arrow loop diagram | Target and Circular ...
- Innovation life cycle - Arrow loop diagram | Strategic planning ...
- Innovation life cycle - Arrow loop diagram | Project Management ...
- Innovation life cycle - Arrow loop diagram
- Draw Flowcharts with ConceptDraw | Circular Arrows Diagrams ...
- Diffusion of innovations graph | Marketing Diagrams | Roger S ...
- Target and Circular Diagrams | Innovation life cycle - Arrow loop ...
- Innovation life cycle - Arrow loop diagram | Strategic planning cycle ...
- Innovation life cycle - Arrow loop diagram | Circular Arrows ...
- Research cycle - Circle diagram | Innovation life cycle - Arrow loop ...
- Diffusion of innovations graph | Marketing Diagrams | Marketing ...
- Innovation life cycle - Arrow loop diagram | Circular arrows diagram ...
- Innovation life cycle - Arrow loop diagram
- Innovation life cycle - Arrow loop diagram | National Preparedness ...
- Water cycle diagram | Innovation life cycle - Arrow loop diagram ...
- Innovation life cycle - Arrow loop diagram | Basic Flowchart Symbols ...
- Innovation life cycle - Arrow loop diagram | Program to Make Flow ...
- Circular arrows diagram - BPM life cycle | Innovation life cycle ...
- Innovation life cycle - Arrow loop diagram