 ConceptDraw Solution Park
ConceptDraw Solution Park collects graphic extensions, examples and learning materials
How tо Represent Information Graphically
ConceptDraw Infographics is a great visual tool for communicating the large amounts of data and graphic visualization and representations of data and information.HelpDesk
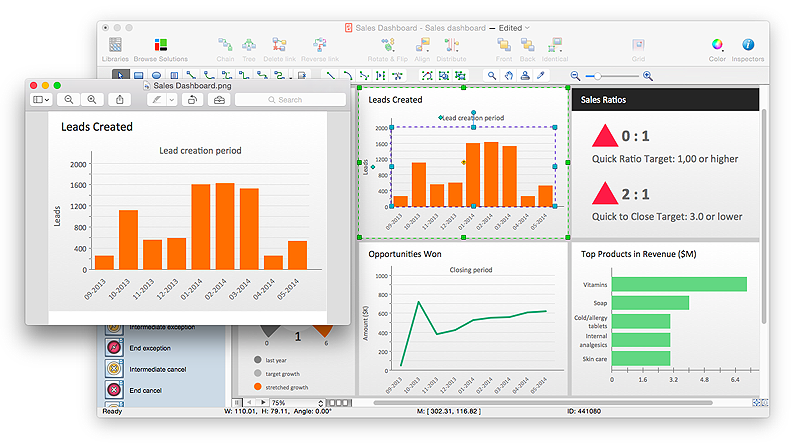
How to Save a Drawing as a Graphic File in ConceptDraw PRO
ConceptDraw PRO can save your drawings and diagrams in a number of highly useful formats, including graphic files. You can save your drawing as a .PNG, .JPG, or other graphic format file.
 What are Infographics Area
Solutions of the area What is Infographics from ConceptDraw Solution Park collect templates, samples and vector stencils libraries with design elements for the drawing information graphics.
Internet solutions with ConceptDraw PRO
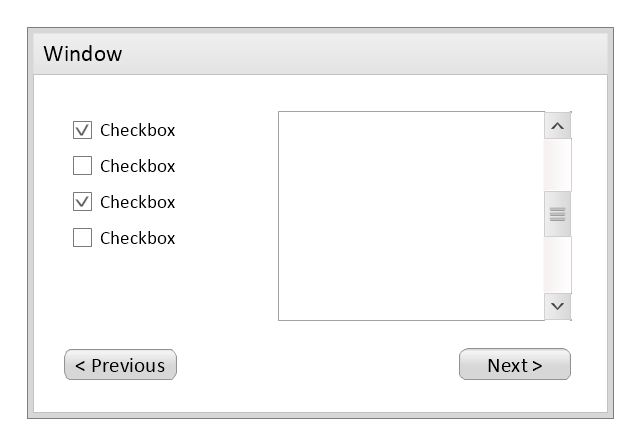
ConceptDraw is a good means of visualization of information of any kind as it features powerful graphic capabilities. The conception of using ConceptDraw and open formats by the programs that work with Internet can be used for displaying any data and any structure in Internet.Use this template to prototype and design the wireframe graphic user interface (GUI).
"A website wireframe, also known as a page schematic or screen blueprint, is a visual guide that represents the skeletal framework of a website. Wireframes are created for the purpose of arranging elements to best accomplish a particular purpose. The purpose is usually being informed by a business objective and a creative idea. The wireframe depicts the page layout or arrangement of the website’s content, including interface elements and navigational systems, and how they work together. The wireframe usually lacks typographic style, color, or graphics, since the main focus lies in functionality, behavior, and priority of content. In other words, it focuses on what a screen does, not what it looks like. Wireframes can be pencil drawings or sketches on a whiteboard, or they can be produced by means of a broad array of free or commercial software applications. Wireframes are generally created by business analysts, user experience designers, developers, visual designers and other roles with expertise in interaction design, information architecture and user research.
Wireframes focus on:
(1) The kinds of information displayed.
(2) The range of functions available.
(3) The relative priorities of the information and functions.
(4) The rules for displaying certain kinds of information.
(5) The effect of different scenarios on the display.
The website wireframe connects the underlying conceptual structure, or information architecture, to the surface, or visual design of the website. Wireframes help establish functionality, and the relationships between different screen templates of a website. An iterative process, creating wireframes is an effective way to make rapid prototypes of pages, while measuring the practicality of a design concept. Wireframing typically begins between “high-level structural work - like flowcharts or site maps - and screen designs.” Within the process of building a website, wireframing is where thinking becomes tangible.
Aside from websites, wireframes are utilized for the prototyping of mobile sites, computer applications, or other screen-based products that involve human-computer interaction." [Website wireframe. Wikipedia]
The wireframe GUI template for the ConceptDraw PRO diagramming and vector drawing software is included in the Graphic User Interface solution from the Software Development area of ConceptDraw Solution Park.
Graphic Technologies
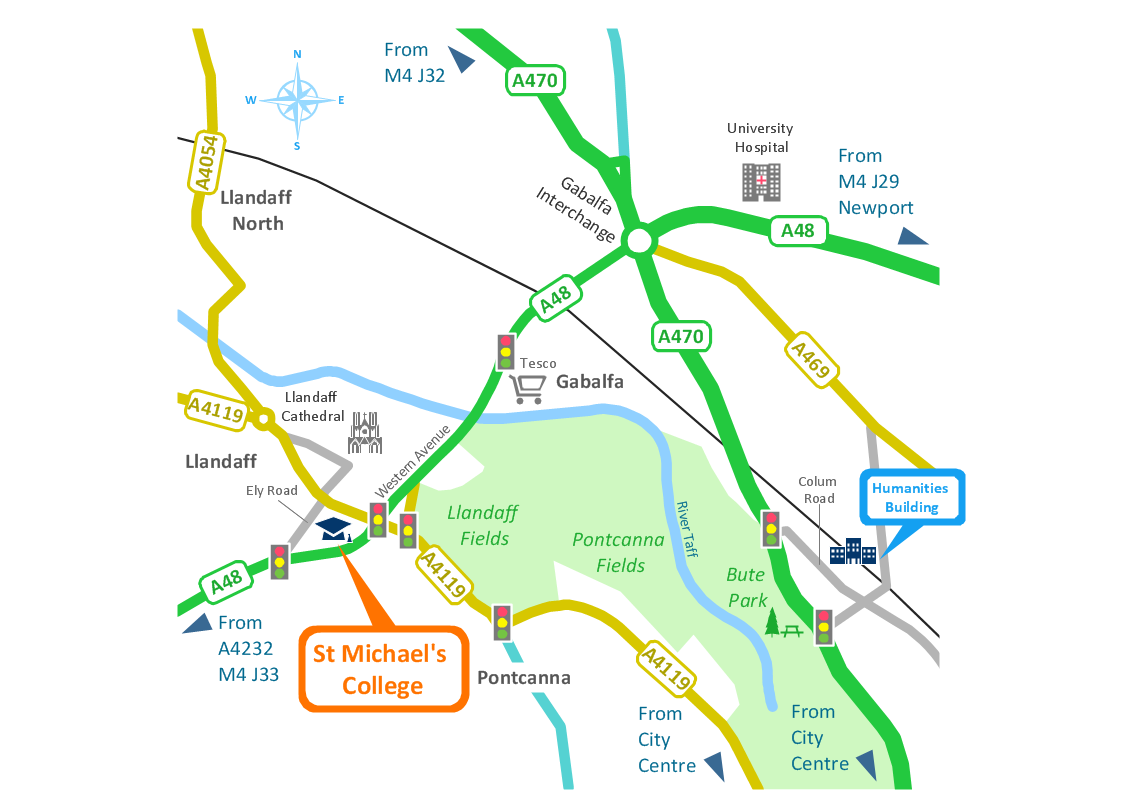
Graphics Technology looks at how to communicate graphically, develop ability to create graphical presentations for varied needs, understand standards and special conventions, develop specific techniques and build an understanding of the impact of graphical presentation on society. If you want to use effective methods for your work, you may need a tool which may let you represent your ideas and goals in graphic way.Spatial infographics Design Elements: Transport Map
Do you like infographics and data visualization? Creating infographics is super-easy with ConceptDraw.- GUI Prototyping with ConceptDraw PRO | Wireframe GUI template ...
- Design elements - Wireframe | Wireframe GUI template | Graphic ...
- Mac OS X Lion user graphic interface (GUI) template | Software ...
- Pyramid Diagram | Pyramid Diagram | Pyramid Diagram | Graphic ...
- GUI Prototyping with ConceptDraw PRO | Graphic User Interface ...
- Design elements - Media signs | Vector graphics - Media signs ...
- Map Infographic Creator | Best Tool for Infographic Construction ...
- Graphs and Charts Area | Mind Map Making Software | Picture ...
- GUI Prototyping with ConceptDraw PRO | Graphic User Interface ...
- ConceptDraw graphic user interface (Mac)
- GUI Prototyping with ConceptDraw PRO | Windows Vista graphic ...
- Universal Diagramming Area | Maps | How to Draw a Natural ...
- Constant improvement of key performance indicators | What is a ...
- Exchange Mind Map with Evernote | iPhone OS (iOS) graphic user ...
- Graphic User Interface
- Software Development | Windows Vista graphic user interface ...
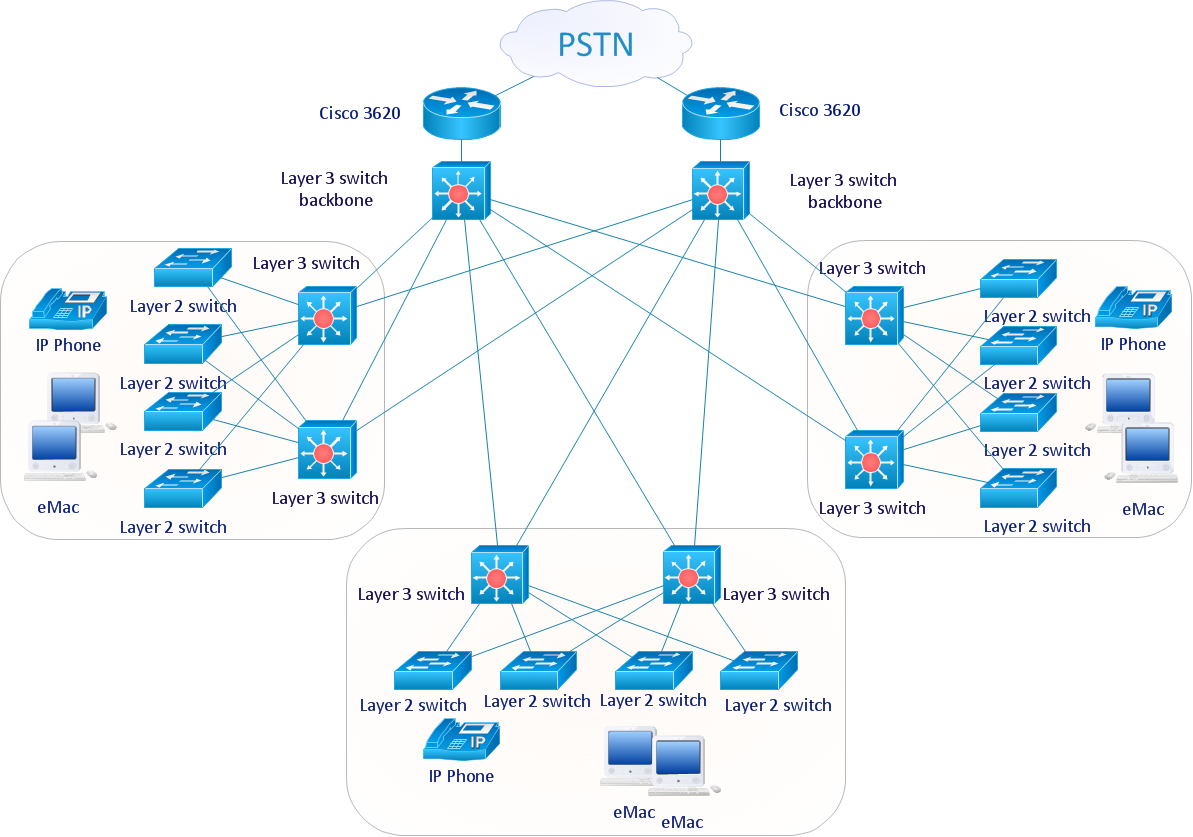
- Data Flow Diagrams | Control and Information Architecture ...
- Universal Diagramming Area | Process Flowchart | Basic Flowchart ...
- What is Infographics Area | How to draw Metro Map style ...
- Universal Diagramming Area | Maps | Nature | How To Draw A ...


