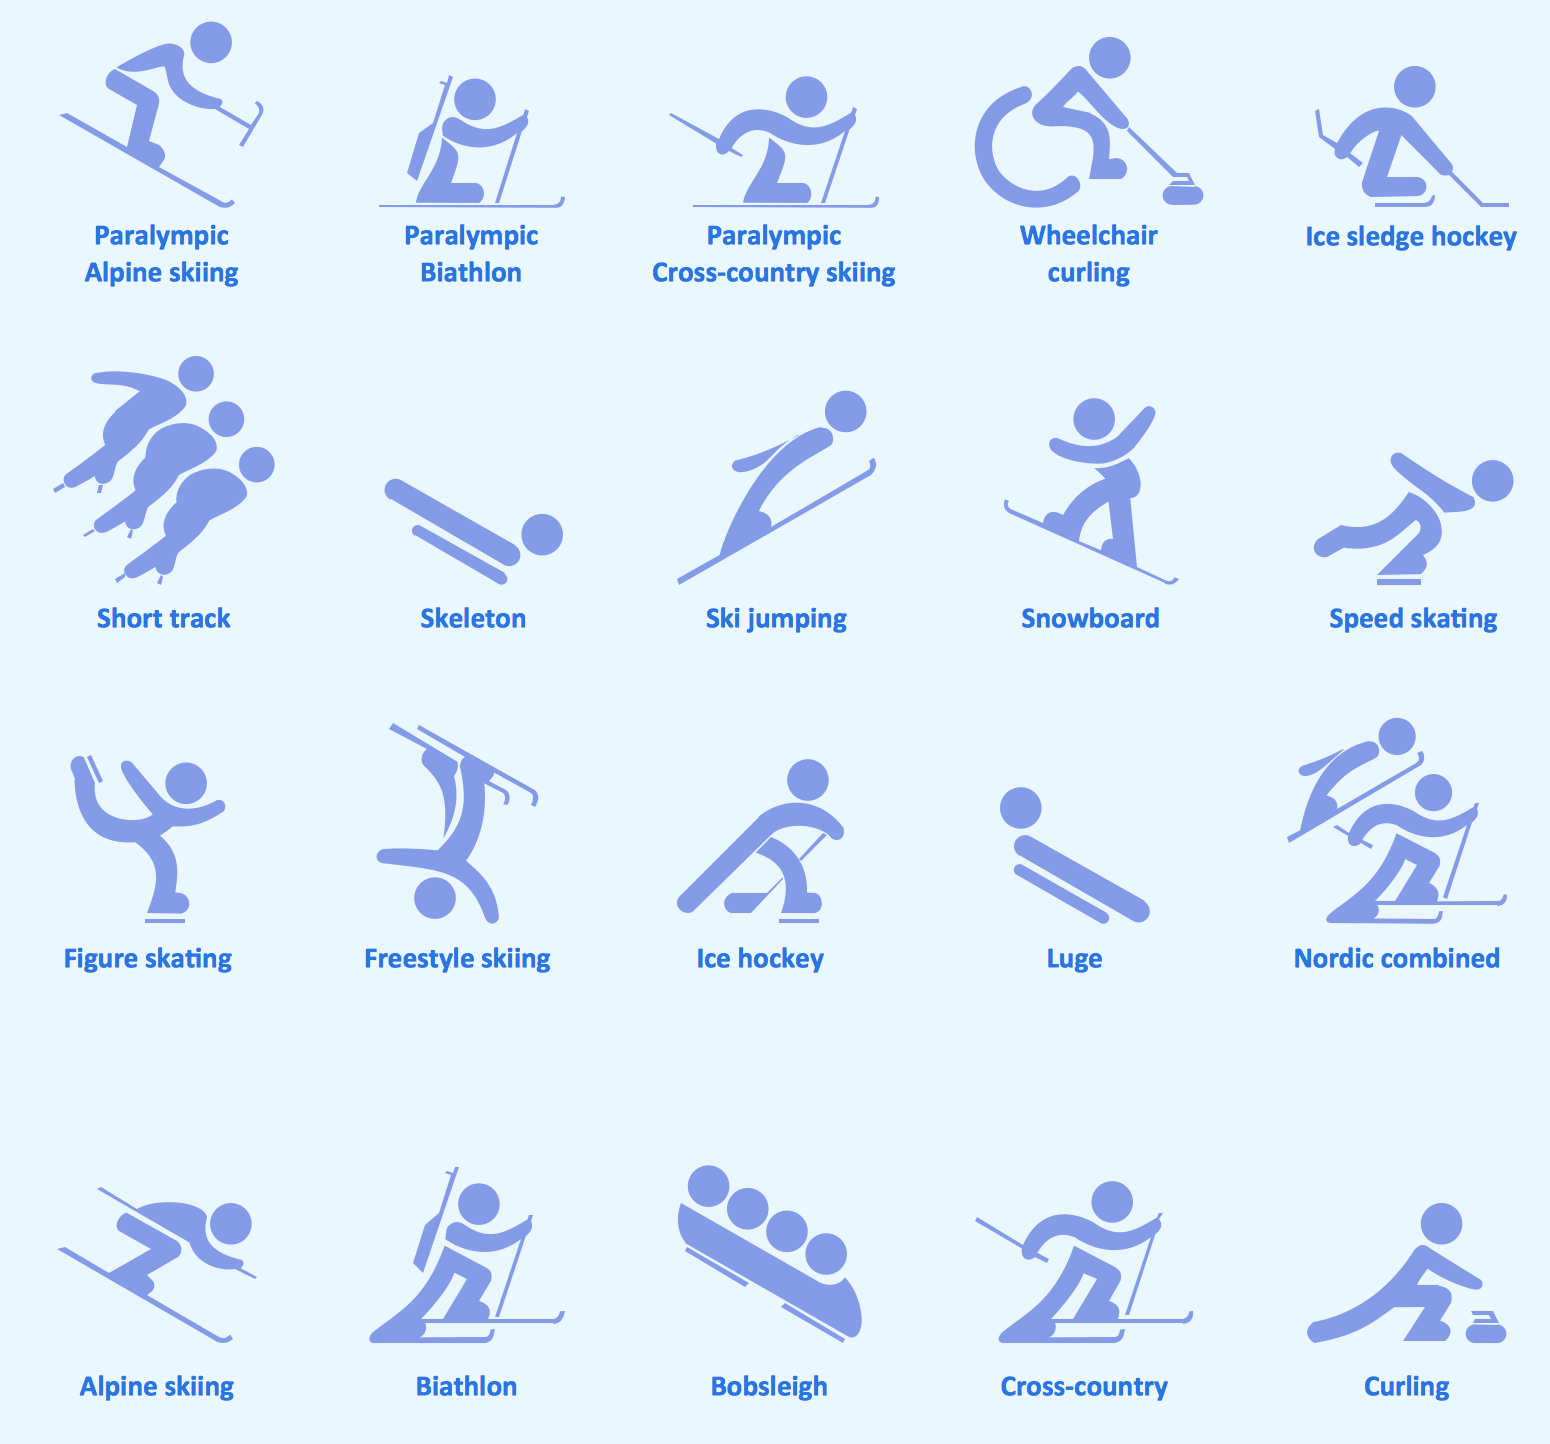
Sport pictograms. Olympic Games
The Winter Sports solution from Sport Area of ConceptDraw Solution Park contains winter sports pictograms you may use illustrating any kind of material about Olympic Games or any other sport competitions.Winter Sports. Olympic Games Illustrations. Medal Summary
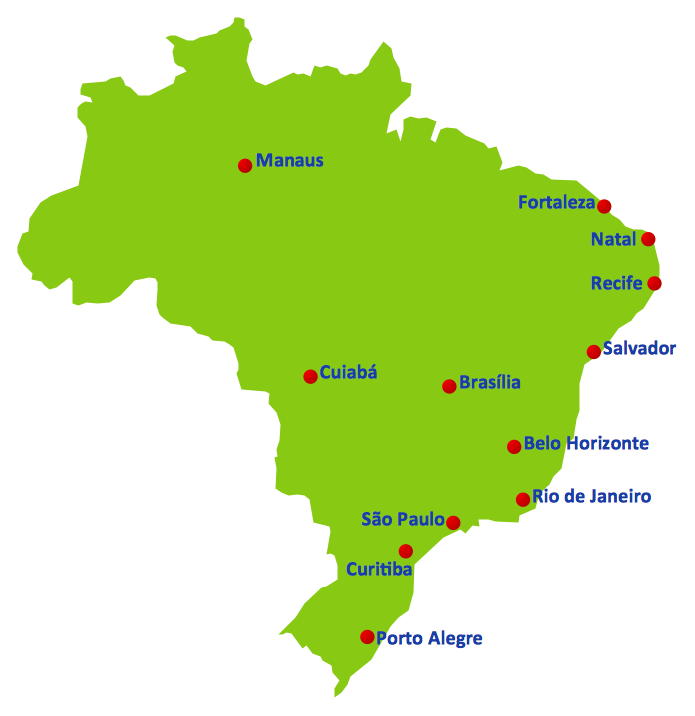
Do you like infographics and data visualization? Creating infographics is super-easy with ConceptDraw.Winter Sports Vector Clipart. Medal Map. Spatial Infographics
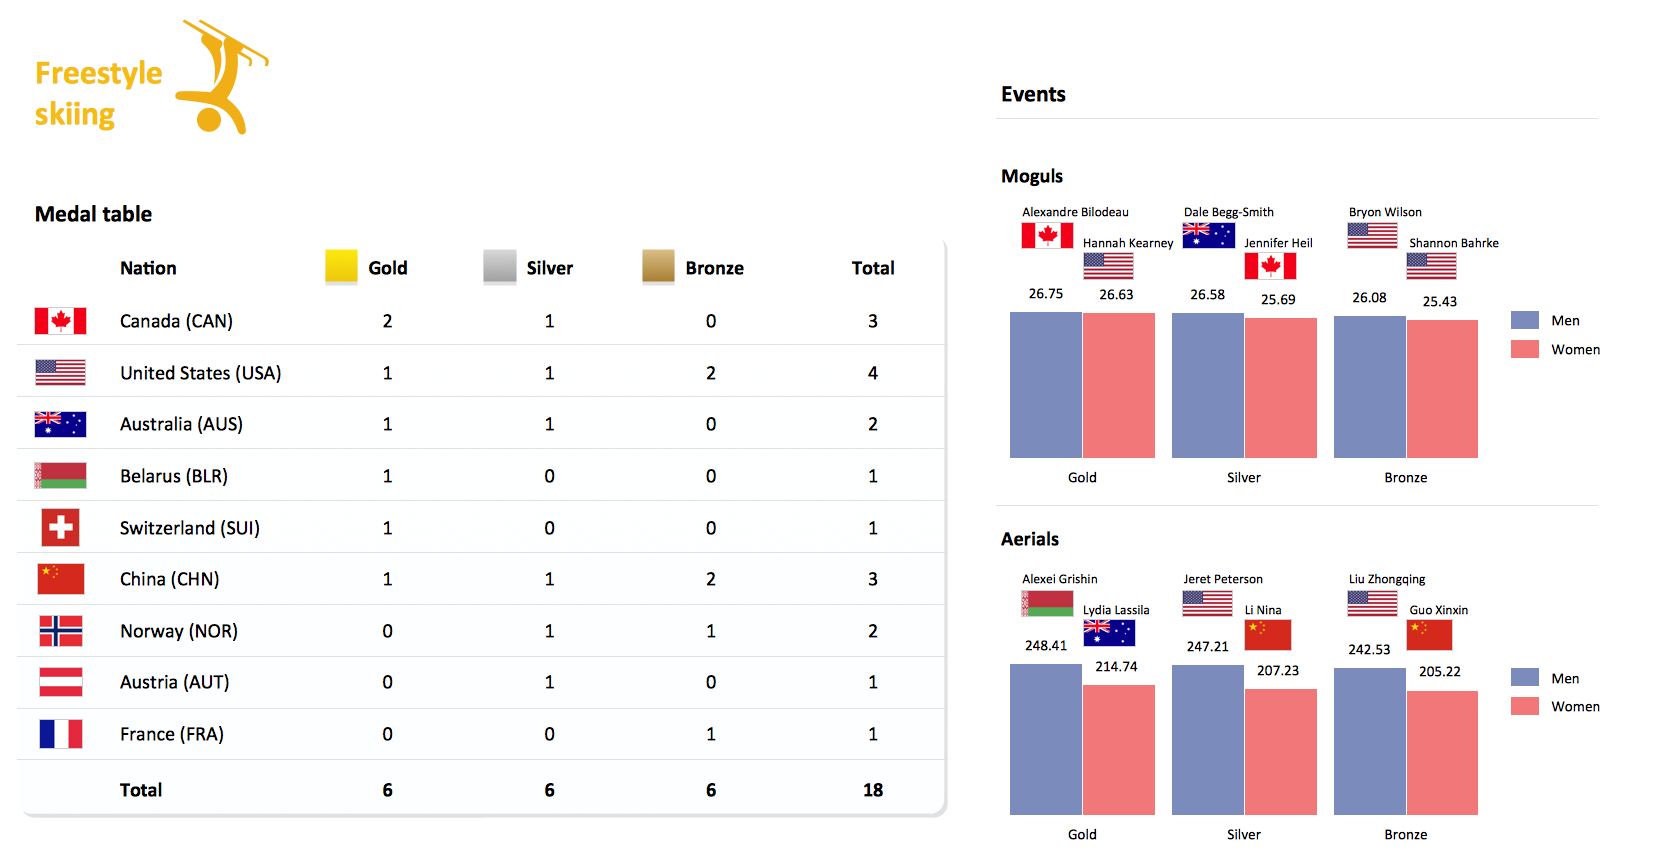
Tracking Olympic results in visual format is the most modern way to deliver statistics to a broad audience. This is a good example of an illustrated table you may easily modify, print, or publish on web from ConceptDraw Winter Sports solution.
 Area Charts
Area Charts are used to display the cumulative totals over time using numbers or percentages; or to show trends over time among related attributes. The Area Chart is effective when comparing two or more quantities. Each series of data is typically represented with a different color, the use of color transparency in an object’s transparency shows overlapped areas and smaller areas hidden behind larger areas.
 Sport Field Plans
Sport Field Plans solution extends ConceptDraw DIAGRAM with samples, templates and libraries of ready-made design elements for developing layouts of sport fields, recreation areas, playground layouts plans, and for professional drawing various sport field plans — for football, basketball, volleyball, golf, baseball, tennis, etc. Depict all your playground layout ideas easily and decisively implement the playground layout designs. Use the final colorful, strict and accurate ConceptDraw's playground layouts when designing the building documentation, brochures, booklets, advertising materials, sports editions, sport maps, business plans, on web sites of sport complexes, sport centers, hotels, etc.
2014 FIFA World Cup
Thanks to the Soccer solution you can design your own soccer-related drawings, diagrams, schemes in seconds. It’s very simple and convenient because Soccer solution contains incredible quantity of ready-to-use predesigned vector objects, professional templates and samples.
 Area Charts
Area Charts are used to display the cumulative totals over time using numbers or percentages; or to show trends over time among related attributes. The Area Chart is effective when comparing two or more quantities. Each series of data is typically represented with a different color, the use of color transparency in an object’s transparency shows overlapped areas and smaller areas hidden behind larger areas.
Drawing Illustration
The Nature Solution addition to ConceptDraw Solution Park for ConceptDraw DIAGRAM includes new libraries that provide a wide range nature objects and it can be used in many areas.
 Entity-Relationship Diagram (ERD)
An Entity-Relationship Diagram (ERD) is a visual presentation of entities and relationships. That type of diagrams is often used in the semi-structured or unstructured data in databases and information systems. At first glance ERD is similar to a flowch
Beauty in nature Illustrations and Clipart
Nature solution expands our software possibilities to create beautiful illustrations and cliparts with the new library which contains 17 vector objects.- Winter Sports. Olympic Games Infographics . Medal Table | Winter ...
- Winter Sports. Olympic Games Infographics . Medal Table | Winter ...
- Winter Sports. Olympic Games Illustrations. Medal Summary | Sport ...
- Winter Sports. Olympic Games Infographics . Medal Table | Winter ...
- Winter Sports. Olympic Games Illustrations. Medal Summary | Winter ...
- Winter Sports. Olympic Games Infographics . Medal Table | Winter ...
- Winter Sports. Using Olympic Games Clipart to Illustrate Tournament ...
- Winter Sports Vector Clipart. Medal Map. Spatial Infographics ...
- Winter Sports | Winter Sports. Olympic Games Infographics . Medal ...
- Winter Sports. Olympic Games Infographics . Medal Table | Winter ...


