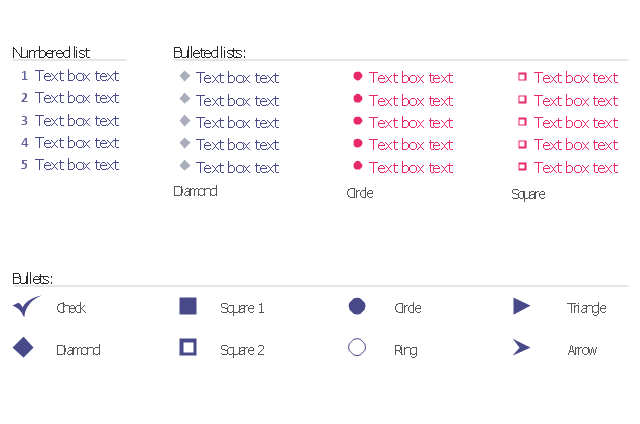
The vector stencils library "Bulleted and numbered lists" contains 12 elements of bulleted and numbered lists, and bullets for creating typography infographics.
"In typography, a bullet ( • ) is a typographical symbol or glyph used to introduce items in a list. ... The bullet symbol may take any of a variety of shapes, such as circular, square, diamond, arrow, etc., and typical word processor software offer a wide selection of shapes and colours. Several regular symbols are conventionally used in ASCII-only text or another environments where bullet characters are not available, such as * (asterisk), - (hyphen), . (period), and even o (lowercase O). Of course, when writing by hand, bullets may be drawn in any style. Historically, the index symbol was popular for similar uses." [Bullet (typography). Wikipedia]
The example "Design elements - Bulleted and numbered lists" was created using the ConceptDraw PRO diagramming and vector drawing software extended with the Typography Infographics solition from the area "What is infographics" in ConceptDraw Solution Park.
Typography infographics elements - Bulleted and numbered lists
HelpDesk
How to Create a Typography Infographic Using ConceptDraw PRO

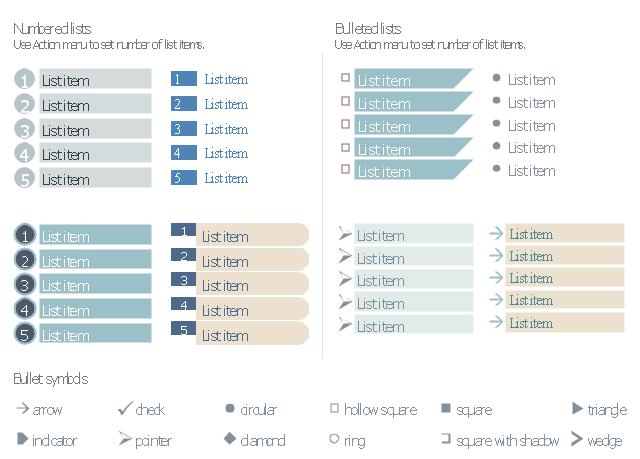
The vector stencils library "Management list blocks" contains 20 list block shapes: numbered list, bulleted list, bullets.
Use these list elements to design your management infograms.
"In typography, a bullet is a typographical symbol or glyph used to introduce items in a list. ...
The bullet symbol may take any of a variety of shapes, such as circular, square, diamond, arrow, etc. ...
Bullets are most often used in technical writing, reference works, notes and presentations. ...
Bulleted items – known as "bullet points" – may be short phrases, single sentences, or of paragraph length. Bulleted items are not usually terminated with a full stop if they are not complete sentences, although it is not rare to terminate every item except the last one with a semicolon, and terminate the last item with a full stop. It is correct to terminate a bullet point with a full stop if the text within that item consists of one 'full' sentence or more." [Bullet (typography). Wikipedia]
The shapes example "Design elements - Management list blocks" was created using the ConceptDraw PRO diagramming and vector drawing software extended with the Management Infographics solition from the area "Business Infographics" in ConceptDraw Solution Park.
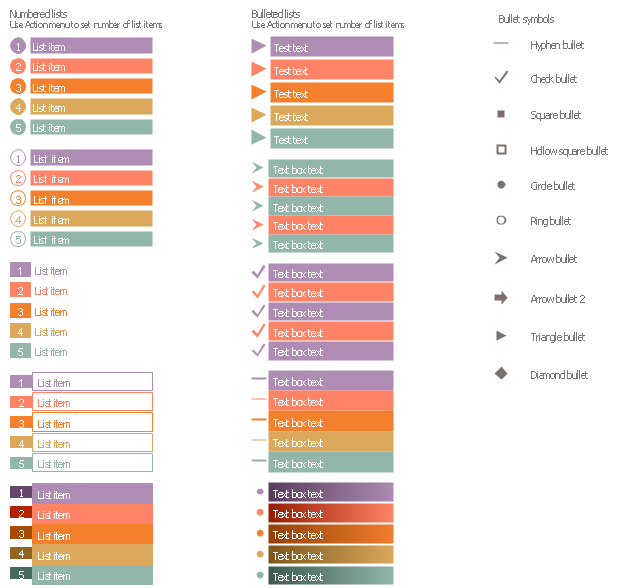
Numbered lists, bulleted lists, bullets
The vector stencils library "List blocks" contains 20 numbered list elements, bulleted list elements and bullet symbols for creating marketing infograms.
"In typography, a bullet ( • ) is a typographical symbol or glyph used to introduce items in a list. ...
The bullet symbol may take any of a variety of shapes, such as circular, square, diamond, arrow, etc., and typical word processor software offer a wide selection of shapes and colours. ...
Bullets are most often used in technical writing, reference works, notes and presentations." [Bullet (typography). Wikipedia]
The shapes example "Design elements - List blocks" was created using the ConceptDraw PRO diagramming and vector drawing software extended with the Marketing Infographics solition from the area "Business Infographics" in ConceptDraw Solution Park.
Lists
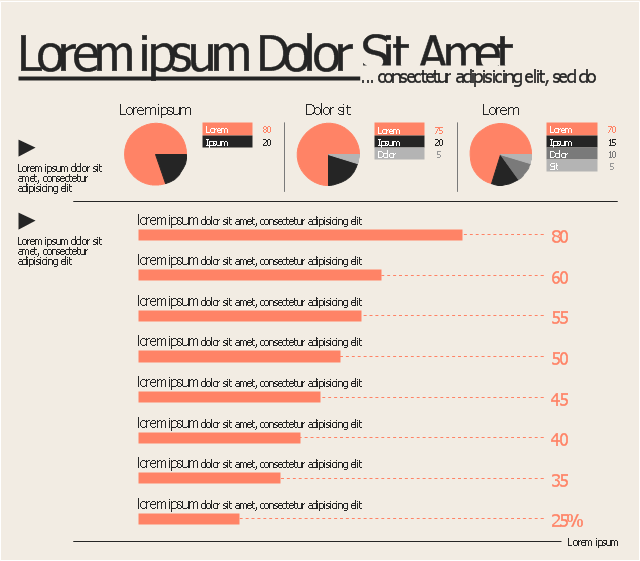
This marketing infographic template consists of design elements: title block, callout blocks, list bullets, pie chart, bullet indicators.
Use it to create your marketing infograms in the ConceptDraw PRO diagramming and vector drawing software.
The template "Marketing infogram 5" is included in the Marketing Infographics solution from the Business Infographics area of ConceptDraw Solution Park.
Use it to create your marketing infograms in the ConceptDraw PRO diagramming and vector drawing software.
The template "Marketing infogram 5" is included in the Marketing Infographics solution from the Business Infographics area of ConceptDraw Solution Park.
Marketing infogram template
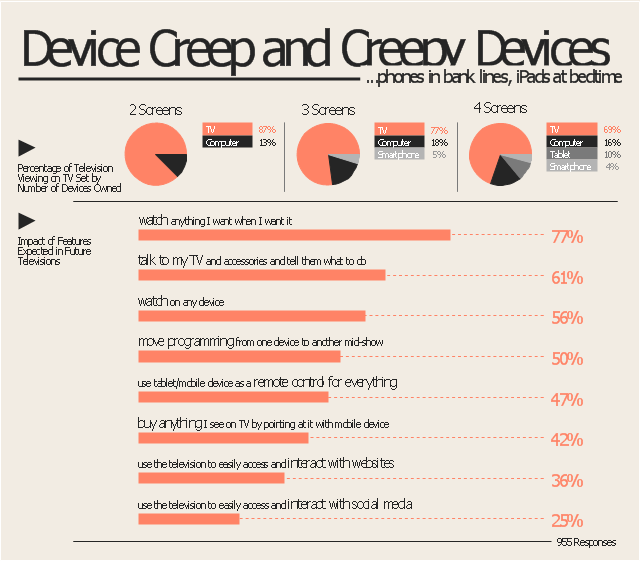
The marketing infogram example "Device creep and creepy devices - Marketing infographics" was created on the base of report "The Multi-Screen Marketer" from the website of the Econsultancy blog.
"The Multi-Screen Marketer addresses rapidly shifting consumer media consumption behavior. As devices get smaller and more powerful, our culture is shifting toward instant communication, immediate information gratification and multi-tasking. Consumers are viewing multiple streams of content simultaneously, across a plethora of devices, and brands are learning to chase them across the gaps.
Brand planning and narratives that span tablets, smartphones, laptops, and televisions can create tremendous potential for engagement and sales; failure to adequately anticipate the ways people are interacting with the technology around them can lead to marketing and messaging that is ignored, or worse, out of touch. ...
Device Creep and Creepy Devices.
Adding devices to our lives means some migration from one device to another, but an equally important trend is simply toward more of everything. More media at more times, with digital content displacing some activities and filling the previously unused spaces in consumers’
lives...phones in bank lines, iPads at bedtime, etc." [econsultancy.com/ reports/ the-multi-screen-marketer]
The marketing infographic example "Device creep and creepy devices" was created using the ConceptDraw PRO diagramming and vector drawing software extended with the Marketing Infographics solition from the area "Business Infographics" in ConceptDraw Solution Park.
Marketing infogram
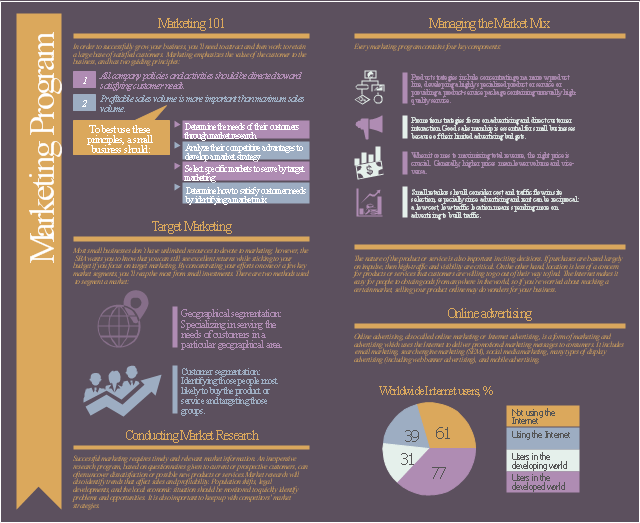
The infogram example "Marketing program" was created on the base of webpages:
(1) Marketing 101. Website of the U.S. Small Business Administration. [sba.gov/ content/ marketing-101-basics]
(2) List of countries by number of Internet users. Wikipedia.
(3) Online advertising. Wikipedia.
"A marketing program is a coordinated, thoughtfully designed set of activities that help you achieve your marketing objectives. Your marketing objectives are strategic sales goals that fit your strengths and are a good way to stretch your business in its current situation. In order to build strong customer relationships and maximize your sales, you need to put every possible marketing tool to work for you. Marketing is a broad field, encompassing elements as diverse as advertising, brand and logo design, sales calls, Web sites, brochures, packaging, shows, conferences and other events, and so on." [dummies.com/ how-to/ content/ designing-your-marketing-program.html]
The infographic example "Marketing program" was created using the ConceptDraw PRO diagramming and vector drawing software extended with the Marketing Infographics solition from the area "Business Infographics" in ConceptDraw Solution Park.
Marketing infogram
HelpDesk
How to Connect Tabular Data (CSV) to a Graphic Indicator on Your Live Dashboard

The vector stencils library "Bulleted and numbered lists" contains 12 elements of bulleted and numbered lists, and bullets for creating typography infographics.
"In typography, a bullet ( • ) is a typographical symbol or glyph used to introduce items in a list. ... The bullet symbol may take any of a variety of shapes, such as circular, square, diamond, arrow, etc., and typical word processor software offer a wide selection of shapes and colours. Several regular symbols are conventionally used in ASCII-only text or another environments where bullet characters are not available, such as * (asterisk), - (hyphen), . (period), and even o (lowercase O). Of course, when writing by hand, bullets may be drawn in any style. Historically, the index symbol was popular for similar uses." [Bullet (typography). Wikipedia]
The example "Design elements - Bulleted and numbered lists" was created using the ConceptDraw PRO diagramming and vector drawing software extended with the Typography Infographics solition from the area "What is infographics" in ConceptDraw Solution Park.
"In typography, a bullet ( • ) is a typographical symbol or glyph used to introduce items in a list. ... The bullet symbol may take any of a variety of shapes, such as circular, square, diamond, arrow, etc., and typical word processor software offer a wide selection of shapes and colours. Several regular symbols are conventionally used in ASCII-only text or another environments where bullet characters are not available, such as * (asterisk), - (hyphen), . (period), and even o (lowercase O). Of course, when writing by hand, bullets may be drawn in any style. Historically, the index symbol was popular for similar uses." [Bullet (typography). Wikipedia]
The example "Design elements - Bulleted and numbered lists" was created using the ConceptDraw PRO diagramming and vector drawing software extended with the Typography Infographics solition from the area "What is infographics" in ConceptDraw Solution Park.
Typography infographics elements - Bulleted and numbered lists
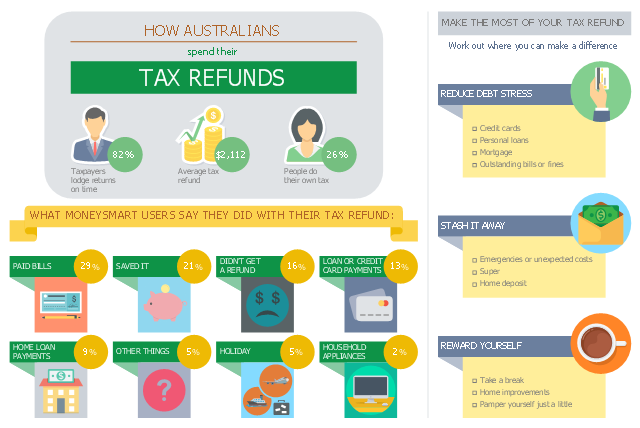
This business infographic sample shows the average tax refund and how people say they spent last year's tax refund. It was designed on the base of the infographic "How Australians spend their tax refunds" from the MoneySmart website of the Australian Securities and Investments Commission (ASIC).
[moneysmart.gov.au/ managing-your-money/ income-tax/ how-australians-spend-their-tax-refunds]
"A tax refund or tax rebate is a refund on taxes when the tax liability is less than the taxes paid. Taxpayers can often get a tax refund on their income tax if the tax they owe is less than the sum of the total amount of the withholding taxes and estimated taxes that they paid, plus the refundable tax credits that they claim. (Tax refunds are money given back at the end of the financial year.)" [Tax refund. Wikipedia]
The business infographic example "How Australians spend their tax refunds" was designed using ConceptDraw PRO diagramming and vector drawing software extended with the Business and Finance solution from Illustration area of ConceptDraw Solution Park.
Infographic
The vector stencils library "Management indicators" contains 14 visual indicators.
Use it to create your management infogram in the ConceptDraw PRO diagramming and vector drawing software.
The example "Management indicators - Vector stencils library" is included in the solution "Marketing infographics" from the "Business infographics" area of ConceptDraw Solution Park.
Use it to create your management infogram in the ConceptDraw PRO diagramming and vector drawing software.
The example "Management indicators - Vector stencils library" is included in the solution "Marketing infographics" from the "Business infographics" area of ConceptDraw Solution Park.
1-Sector donut chart

1-Sector pie chart

2-Bars horizontal bar chart

2-Columns arrow chart
2-Columns arrow chart 2
2-Sectors donut chart

2-Sectors pie chart

Bullet indicator

Progress bar

Radial gauge

Semi-radial gauge

Square chart 10x10 - filling from above

Square chart 10x10 - filling from below

Stickman row pictograph

The vector stencils library "Education indicators" contains 12 graphic indicators.
Use these visual indicators to design your educational infogram.
The vector stencils library "Education indicators" is included in the Education Infographics solution from the Business Infographics area of ConceptDraw Solution Park.
Use these visual indicators to design your educational infogram.
The vector stencils library "Education indicators" is included in the Education Infographics solution from the Business Infographics area of ConceptDraw Solution Park.
1-Sector donut chart

2-Sectors donut chart

1-Sector pie chart

2-Sectors pie chart

2-Bars horizontal bar chart

2-Columns arrow chart
Bullet indicator

Progress bar

Radial gauge

Semi-radial gauge

Square chart 10x10 - filling from above

Stickman row pictograph

 Meter Dashboard
Meter dashboard solution extends ConceptDraw PRO software with templates, samples and vector stencils library with meter indicators for drawing visual dashboards showing quantitative data.
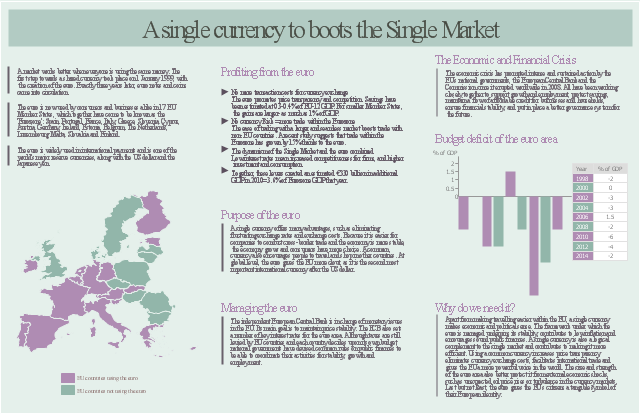
The marketing infogram example "A single currency to boots the Single Market" was created on the base of data from the webpages:
(1) "20 YEARS
of the European
Single Market" from the website of the European Commission. [ec.europa.eu/ internal_ market/ publications/ docs/ 20years/ achievements-web_ en.pdf]
(2) "The euro" from the website of the European Union.
[europa.eu/ about-eu/ basic-information/ money/ euro/ index_ en.htm]
(3) "The euro" from the website of the European Commission. [ec.europa.eu/ economy_ finance/ euro/ index_ en.htm]
(4) "Euro" from Wikipedia. [en.wikipedia.org/ wiki/ Euro]
"A single market is a type of trade bloc which is composed of a free trade area (for goods) with some common policies on product regulation, and freedom of movement of the factors of production (capital and labour) and of enterprise and services. The goal is that the movement of capital, labour, goods, and services between the members is as easy as within them. The physical (borders), technical (standards) and fiscal (taxes) barriers among the member states are removed to the maximum extent possible. These barriers obstruct the freedom of movement of the four factors of production." [Single market. Wikipedia]
The marketing infographic example "A single currency to boots the Single Market" was created using the ConceptDraw PRO diagramming and vector drawing software extended with the Marketing Infographics solition from the area "Business Infographics" in ConceptDraw Solution Park.
Marketing infogram
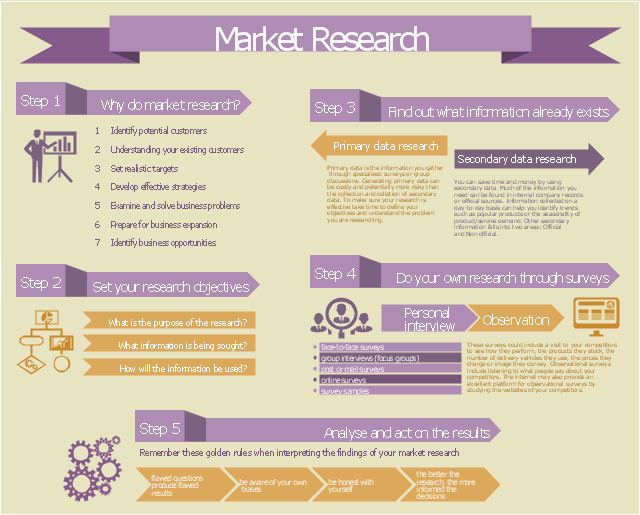
This example of marketing infogram was created on the base of web page "Market research" from the website of West Australian State Government agency Small Business Development Corporation (SBDC).
"Market research is a key part of developing your marketing strategy. It’s about collecting information to give you an insight into your customers’ mind so that you understand what they want, how they gather information and where they come from. You can also do market research to get a better idea of market trends and what is happening in your industry sector.
The information you gather and analyse builds the foundation of good business decisions whether it’s deciding what product or service you’ll offer, where your business should be located, how to distribute your products or how you communicate with consumers." [smallbusiness.wa.gov.au/ market-research]
The example "Marketing Infographics - Market Research" was created using the ConceptDraw PRO diagramming and vector drawing software extended with the Marketing Infographics solition from the area "Business Infographics" in ConceptDraw Solution Park.
Marketing infogram
- Typography Bullet Lists
- Circle Bullets
- Triangular Bullet Typography
- Diamond Bullets
- Design elements - Management list blocks | Design elements - List ...
- Design elements - Bulleted and numbered lists | Design elements ...
- Design elements - List blocks | Design elements - Management list ...
- How to Create a Typography Infographic Using ConceptDraw PRO ...
- Design elements - Education list blocks | Education Information ...
- Design elements - List blocks | Design elements - Management list ...
- Education infogram 4 - Template | Education infogram 5 - Template ...
- ABC - Vector stencils library | Design elements - Callouts | Design ...
- Interior Design Office Layout Plan Design Element | Design ...
- Project management - Design Elements | Management - Design ...
- Marketing Plan Infographic | Presentation design elements - Vector ...
- Management indicators - Vector stencils library | Education ...
- Marketing program - Infographics | Donut Chart Templates ...
- Device creep and creepy devices - Marketing infographics | Design ...
- Marketing Plan Infographic | How to Create Marketing Infographics ...
- Marketing program - Infographics | How to Create a Social Media ...