 ConceptDraw Solution Park
ConceptDraw Solution Park collects graphic extensions, examples and learning materials
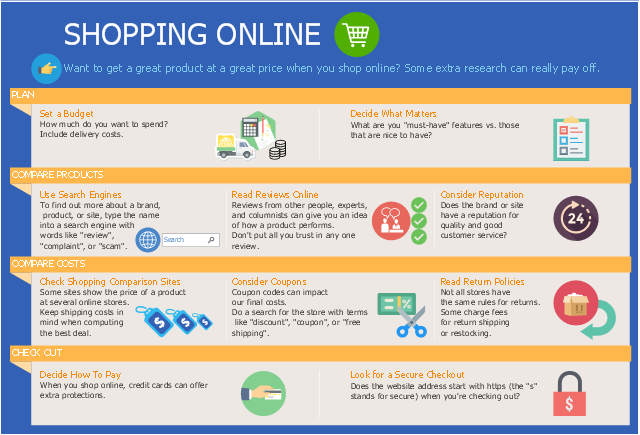
This business infographic sample shows how to get a great product at a great price when you shop online. It was designed on the base of the infographic "Shopping Online" from the Consumer Information website of the U.S. Federal Trade Commission. [consumer.ftc.gov/ sites/ default/ files/ pictures/ 0041-shopping-online-infographic.png]
"Online shopping (sometimes known as e-tail from "electronic retail" or e-shopping) is a form of electronic commerce which allows consumers to directly buy goods or services from a seller over the Internet using a web browser. Alternative names are: e-web-store, e-shop, e-store, Internet shop, web-shop, web-store, online store, online storefront and virtual store. Mobile commerce (or m-commerce) describes purchasing from an online retailer's mobile optimized online site or app." [Online shopping. Wikipedia]
The business infographic example "Shopping Online" was designed using ConceptDraw PRO diagramming and vector drawing software extended with the Business and Finance solution from Illustration area of ConceptDraw Solution Park.
Infographic
How to draw Metro Map style infographics? (London)

HelpDesk
How to Add Data-driven Infographics to a MS Word Document Using ConceptDraw PRO

HelpDesk
How to Create Management Infographics Using ConceptDraw PRO

HelpDesk
How to Create a Typography Infographic Using ConceptDraw PRO

Content Marketing Infographics

 What are Infographic Area
Solutions of the area What is Infographics from ConceptDraw Solution Park collect templates, samples and vector stencils libraries with design elements for the drawing information graphics.
HelpDesk
How to Create Education Infographics

 Spatial Infographics
Spatial infographics solution extends ConceptDraw PRO software with infographic samples, map templates and vector stencils libraries with design elements for drawing spatial information graphics.
- Shopping Online | Design Pictorial Infographics . Design ...
- Online store social media response flowchart | Social Media ...
- Infographic Maker Free Online
- Internet Marketing Infographic | Online Marketing Objectives | How to ...
- Infographic Creator Online Free
- Infographic Creator Free Online
- Online Registration Infographics Vector Images
- Subway infographic design elements - software tools | How to draw ...
- Map Infographic Creator | Map Infographic Maker | Map Infographic ...
- Internet Marketing Infographic | Social Media Marketing Infographic ...
- Infographic Generator | Best Tool for Infographic Construction ...
- Infographic Generator | Map Infographic Creator | Free Sentence ...
- Internet Marketing Infographic | Social Media Marketing Infographic ...
- What are Infographic Area | Project —Task Trees and Dependencies ...
- Shopping Online
- Shopping Bag Infographic
- Internet marketing - Concept map | The Best Flowchart Software ...
- Infographic Design Agency
- Buffering Video Infographic
- What are Infographic Area | Mobile User Web Visit Diagram Visio