Process Flowchart


 Engineering
This solution extends ConceptDraw PRO v9.4 with the ability to visualize industrial systems in electronics, electrical, chemical, process, and mechanical engineering.
Types of Flowcharts


Bar Diagrams for Problem Solving. Create event management bar charts with Bar Graphs Solution

 ATM UML Diagrams
The ATM UML Diagrams solution lets you create ATM solutions and UML examples. Use ConceptDraw PRO as a UML diagram creator to visualize a banking system.
"Causes in the diagram are often categorized, such as to the 6 M's ...
The 6 Ms (used in manufacturing industry):
(1) Machine (technology);
(2) Method (process);
(3) Material (Includes Raw Material, Consumables and Information.);
(4) Man Power (physical work)/ Mind Power (brain work): Kaizens, Suggestions;
(5) Measurement (Inspection);
(6) Milieu/ Mother Nature (Environment).
The original 6Ms used by the Toyota Production System have been expanded by some to include the following and are referred to as the 8Ms. However, this is not globally recognized. It has been suggested to return to the roots of the tools and to keep the teaching simple while recognizing the original intent; most programs do not address the 8Ms.
(7) Management/ Money Power;
(8) Maintenance." [Ishikawa diagram. Wikipedia]
This 8Ms Ishikawa diagram (manufacturing cause and effect diagram) template is included in the Fishbone Diagram solution from the Management area of ConceptDraw Solution Park.
8Ms Ishikawa diagram

Bar Diagrams for Problem Solving. Create manufacturing and economics bar charts with Bar Graphs Solution

 Fishbone Diagram
Fishbone Diagrams solution extends ConceptDraw PRO software with templates, samples and library of vector stencils for drawing the Ishikawa diagrams for cause and effect analysis.
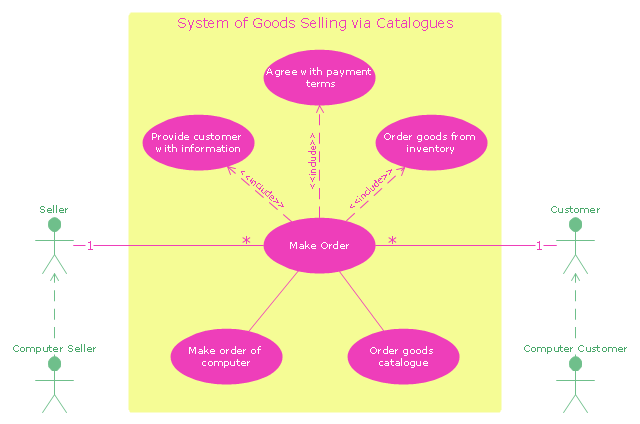
"A catalog merchant (catalogue merchant in British and Canadian English) is a form of retailing. The typical merchant sells a wide variety of household and personal products, with many emphasizing jewelry. Unlike a self-serve retail store, most of the items are not displayed; customers select the products from printed catalogs in the store and fill out an order form. The order is brought to the sales counter, where a clerk retrieves the items from the warehouse area to a payment and checkout station. ...
The catalog merchant has generally lower prices than other retailers and lower overhead expenses due to the smaller size of store and lack of large showroom space.
There are a few key benefits to this approach. By operating as an in-store catalog sales center, it could be exempt from the "Resale price maintenance" policy of the manufacturers, which can force conventional retailers to charge a minimum sales price to prevent price-cutting competition; it also reduces the risk of merchandise theft, known in the industry as shrinkage.
From the consumer's point of view, there are potential advantages and disadvantages. The catalog showroom approach allows customers to shop without having to carry their purchases throughout the store as they shop. Possible downsides include that customers may be required to give their contact information when an order is placed, take the time to fill out order forms, and wait a period of time for their order to be available for purchase. This wait may be days long, one of the chief vulnerabilities of the catalog showroom approach." [Catalog merchant. Wikipedia]
The UML use case diagram example "System of goods selling via catalogues" was created using the ConceptDraw PRO diagramming and vector drawing software extended with the Rapid UML solution from the Software Development area of ConceptDraw Solution Park.
UML use case diagram
 Entity-Relationship Diagram (ERD)
Entity-Relationship Diagram (ERD) solution extends ConceptDraw PRO software with templates, samples and libraries of vector stencils from drawing the ER-diagrams by Chen's and crow’s foot notations.
Process Flow Diagram

Wiring Diagrams with ConceptDraw PRO

- Industrial Process System Diagram
- Industrial Process Diagram
- How To use House Electrical Plan Software | Electrical Drawing ...
- Design elements - Industrial equipment | Design elements ...
- Process Flowchart | Design elements - Industrial equipment ...
- Industrial Machines Diagrams
- Process Flowchart | Process Engineering | Process Flow Diagram ...
- Industrial Floor Plan Design
- Process Flowchart | Piping and Instrumentation Diagram Software ...
- Industrial Quality Diagram
- Chemical Process Equipment Which Are Use In Chemical Industry
- Diagram Banking Industry By Using Swot
- Plant Layout Plans | Warehouse with conveyor system - Floor plan ...
- Drawing Symbol Used In Industry
- Fishbone Diagram Example For Manufacturing Industry
- Block Diagrams
- Process Flowchart | TQM Diagram Example | Organizational ...
- Types of Flowcharts | Diagram Of Quality Control In The Oil Industry
- Application Of Fluid Circuit Diagrams In Food Processing Industry
- Mechanical Industries Drawings Symbols